
Page 359 - Solid Waste Analysis and Minimization a Systems Approach
P. 359
WASTE MANAGEMENT GOALS AND OPPORTUNITIES 337
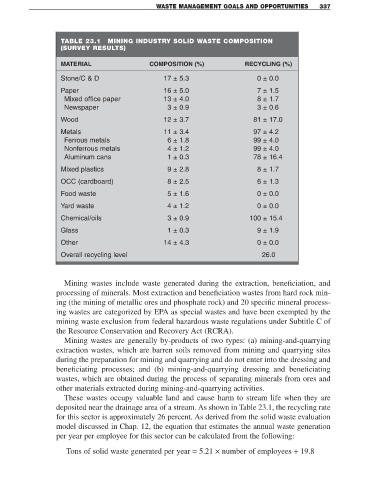
TABLE 23.1 MINING INDUSTRY SOLID WASTE COMPOSITION
(SURVEY RESULTS)
MATERIAL COMPOSITION (%) RECYCLING (%)
Stone/C & D 17 ± 5.3 0 ± 0.0
Paper 16 ± 5.0 7 ± 1.5
Mixed office paper 13 ± 4.0 8 ± 1.7
Newspaper 3 ± 0.9 3 ± 0.6
Wood 12 ± 3.7 81 ± 17.0
Metals 11 ± 3.4 97 ± 4.2
Ferrous metals 6 ± 1.8 99 ± 4.0
Nonferrous metals 4 ± 1.2 99 ± 4.0
Aluminum cans 1 ± 0.3 78 ± 16.4
Mixed plastics 9 ± 2.8 8 ± 1.7
OCC (cardboard) 8 ± 2.5 6 ± 1.3
Food waste 5 ± 1.6 0 ± 0.0
Yard waste 4 ± 1.2 0 ± 0.0
Chemical/oils 3 ± 0.9 100 ± 15.4
Glass 1 ± 0.3 9 ± 1.9
Other 14 ± 4.3 0 ± 0.0
Overall recycling level 26.0
Mining wastes include waste generated during the extraction, beneficiation, and
processing of minerals. Most extraction and beneficiation wastes from hard rock min-
ing (the mining of metallic ores and phosphate rock) and 20 specific mineral process-
ing wastes are categorized by EPA as special wastes and have been exempted by the
mining waste exclusion from federal hazardous waste regulations under Subtitle C of
the Resource Conservation and Recovery Act (RCRA).
Mining wastes are generally by-products of two types: (a) mining-and-quarrying
extraction wastes, which are barren soils removed from mining and quarrying sites
during the preparation for mining and quarrying and do not enter into the dressing and
beneficiating processes; and (b) mining-and-quarrying dressing and beneficiating
wastes, which are obtained during the process of separating minerals from ores and
other materials extracted during mining-and-quarrying activities.
These wastes occupy valuable land and cause harm to stream life when they are
deposited near the drainage area of a stream. As shown in Table 23.1, the recycling rate
for this sector is approximately 26 percent. As derived from the solid waste evaluation
model discussed in Chap. 12, the equation that estimates the annual waste generation
per year per employee for this sector can be calculated from the following:
Tons of solid waste generated per year = 5.21 × number of employees + 19.8