Page 403 - Solid Waste Analysis and Minimization a Systems Approach
P. 403

WASTE MANAGEMENT GOALS AND OPPORTUNITIES              381


                    28.2 Waste Management Goals


                    and Opportunities


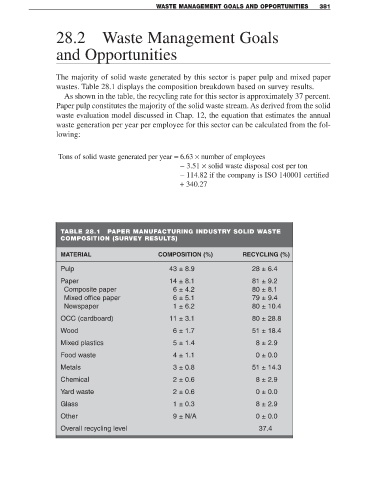
                    The majority of solid waste generated by this sector is paper pulp and mixed paper
                    wastes. Table 28.1 displays the composition breakdown based on survey results.
                      As shown in the table, the recycling rate for this sector is approximately 37 percent.
                    Paper pulp constitutes the majority of the solid waste stream. As derived from the solid
                    waste evaluation model discussed in Chap. 12, the equation that estimates the annual
                    waste generation per year per employee for this sector can be calculated from the fol-
                    lowing:


                    Tons of solid waste generated per year = 6.63 × number of employees
                                                             − 3.51 × solid waste disposal cost per ton
                                                             − 114.82 if the company is ISO 140001 certified
                                                             + 340.27


                     TABLE 28.1      PAPER MANUFACTURING INDUSTRY SOLID WASTE
                     COMPOSITION (SURVEY RESULTS)

                     MATERIAL                        COMPOSITION (%)             RECYCLING (%)

                     Pulp                                43 ± 8.9                   28 ± 6.4
                     Paper                               14 ± 8.1                   81 ± 9.2
                      Composite paper                     6 ± 4.2                   80 ± 8.1
                      Mixed office paper                   6 ± 5.1                   79 ± 9.4
                      Newspaper                           1 ± 6.2                   80 ± 10.4
                     OCC (cardboard)                     11 ± 3.1                   80 ± 28.8

                     Wood                                 6 ± 1.7                   51 ± 18.4
                     Mixed plastics                       5 ± 1.4                     8 ± 2.9

                     Food waste                           4 ± 1.1                     0 ± 0.0
                     Metals                               3 ± 0.8                   51 ± 14.3

                     Chemical                             2 ± 0.6                     8 ± 2.9
                     Yard waste                           2 ± 0.6                     0 ± 0.0

                     Glass                                1 ± 0.3                     8 ± 2.9
                     Other                                9 ± N/A                     0 ± 0.0

                     Overall recycling level                                           37.4
   398   399   400   401   402   403   404   405   406   407   408