
Page 413 - Solid Waste Analysis and Minimization a Systems Approach
P. 413
WASTE MANAGEMENT GOALS AND OPPORTUNITIES 391
29.2 Waste Management Goals
and Opportunities
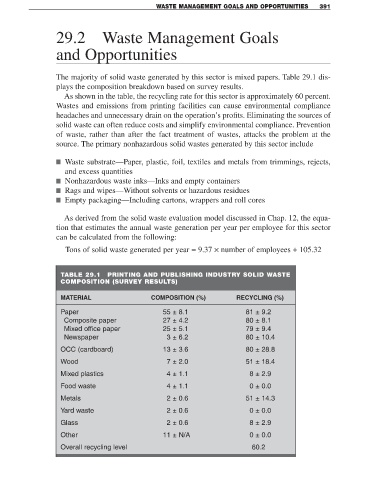
The majority of solid waste generated by this sector is mixed papers. Table 29.1 dis-
plays the composition breakdown based on survey results.
As shown in the table, the recycling rate for this sector is approximately 60 percent.
Wastes and emissions from printing facilities can cause environmental compliance
headaches and unnecessary drain on the operation’s profits. Eliminating the sources of
solid waste can often reduce costs and simplify environmental compliance. Prevention
of waste, rather than after the fact treatment of wastes, attacks the problem at the
source. The primary nonhazardous solid wastes generated by this sector include
■ Waste substrate—Paper, plastic, foil, textiles and metals from trimmings, rejects,
and excess quantities
■ Nonhazardous waste inks—Inks and empty containers
■ Rags and wipes—Without solvents or hazardous residues
■ Empty packaging—Including cartons, wrappers and roll cores
As derived from the solid waste evaluation model discussed in Chap. 12, the equa-
tion that estimates the annual waste generation per year per employee for this sector
can be calculated from the following:
Tons of solid waste generated per year = 9.37 × number of employees + 105.32
TABLE 29.1 PRINTING AND PUBLISHING INDUSTRY SOLID WASTE
COMPOSITION (SURVEY RESULTS)
MATERIAL COMPOSITION (%) RECYCLING (%)
Paper 55 ± 8.1 81 ± 9.2
Composite paper 27 ± 4.2 80 ± 8.1
Mixed office paper 25 ± 5.1 79 ± 9.4
Newspaper 3 ± 6.2 80 ± 10.4
OCC (cardboard) 13 ± 3.6 80 ± 28.8
Wood 7 ± 2.0 51 ± 18.4
Mixed plastics 4 ± 1.1 8 ± 2.9
Food waste 4 ± 1.1 0 ± 0.0
Metals 2 ± 0.6 51 ± 14.3
Yard waste 2 ± 0.6 0 ± 0.0
Glass 2 ± 0.6 8 ± 2.9
Other 11 ± N/A 0 ± 0.0
Overall recycling level 60.2