
Page 431 - Solid Waste Analysis and Minimization a Systems Approach
P. 431
CONSTRAINTS AND CONSIDERATIONS 409
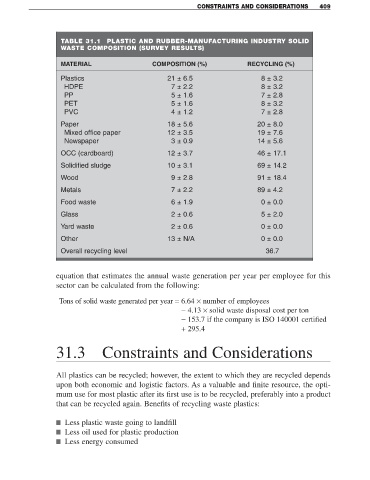
TABLE 31.1 PLASTIC AND RUBBER-MANUFACTURING INDUSTRY SOLID
WASTE COMPOSITION (SURVEY RESULTS)
MATERIAL COMPOSITION (%) RECYCLING (%)
Plastics 21 ± 6.5 8 ± 3.2
HDPE 7 ± 2.2 8 ± 3.2
PP 5 ± 1.6 7 ± 2.8
PET 5 ± 1.6 8 ± 3.2
PVC 4 ± 1.2 7 ± 2.8
Paper 18 ± 5.6 20 ± 8.0
Mixed office paper 12 ± 3.5 19 ± 7.6
Newspaper 3 ± 0.9 14 ± 5.6
OCC (cardboard) 12 ± 3.7 46 ± 17.1
Solidified sludge 10 ± 3.1 69 ± 14.2
Wood 9 ± 2.8 91 ± 18.4
Metals 7 ± 2.2 89 ± 4.2
Food waste 6 ± 1.9 0 ± 0.0
Glass 2 ± 0.6 5 ± 2.0
Yard waste 2 ± 0.6 0 ± 0.0
Other 13 ± N/A 0 ± 0.0
Overall recycling level 36.7
equation that estimates the annual waste generation per year per employee for this
sector can be calculated from the following:
Tons of solid waste generated per year = 6.64 × number of employees
− 4.13 × solid waste disposal cost per ton
− 153.7 if the company is ISO 140001 certified
+ 295.4
31.3 Constraints and Considerations
All plastics can be recycled; however, the extent to which they are recycled depends
upon both economic and logistic factors. As a valuable and finite resource, the opti-
mum use for most plastic after its first use is to be recycled, preferably into a product
that can be recycled again. Benefits of recycling waste plastics:
■ Less plastic waste going to landfill
■ Less oil used for plastic production
■ Less energy consumed