
Page 158 - Standard Handbook Petroleum Natural Gas Engineering VOLUME2
P. 158
Formation Evaluation 127
500°F
400°F
300°F
200°F
150°F
100°F
75°F
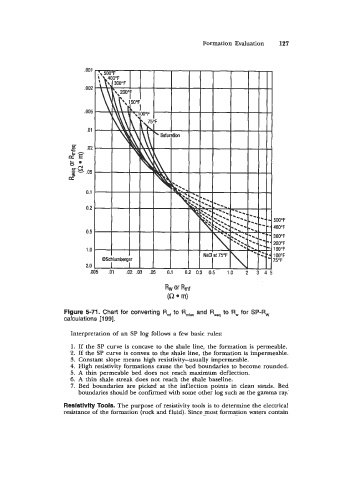
Figure 5-71. Chart for converting R,, to Rmfeq and Rwaq to R, for SP-R,
calculations [199].
Interpretation of an SP log follows a few basic rules:
1. If the SP curve is concave to the shale line, the formation is permeable.
2. If the SP curve is convex to the shale line, the formation is impermeable.
3. Constant slope means high resistivity-usually impermeable.
4. High resistivity formations cause the bed boundaries to become rounded.
5. A thin permeable bed does not reach maximum deflection.
6. A thin shale streak does not reach the shale baseline.
7. Bed boundaries are picked at the inflection points in clean sands. Bed
boundaries should be confirmed with some other log such as the gamma ray.'
Resistivity Tools. The purpose of resistivity tools is to determine the electrical
resistance of the formation (rock and fluid). Since most formation waters contain