Page 275 - Standard Handbook Petroleum Natural Gas Engineering VOLUME2
P. 275

244    Reservoir Engineering
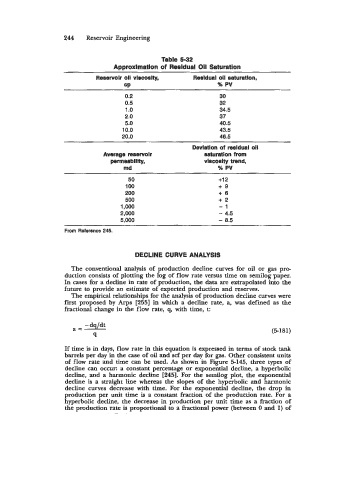

                                                 Table 5-32
                                   Approximation of  Residual Oil Saturation
                              Reservoir oil viscoslty,    Resldual oil saturation,
                                      CP                          % PV
                                      0.2                         30
                                      0.5                         32
                                      1 .o                        34.5
                                      2.0                         37
                                      5.0                         40.5
                                     10.0                         43.5
                                     20.0                         46.5
                                                          Deviation of  resldual oll
                                Average reservoir             saturation from
                                  permeablllty,               viscosity trend,
                                      md                          % PV
                                       50                         +12
                                      100                         +9
                                      200                         +6
                                      500                         +2
                                     1,000                        -1
                                     2,000                        - 4.5
                                     5,000                        - 8.5
                    ~
                    From Reference 245.


                                         DECLINE CURVE ANALYSIS
                      The conventional analysis of  production decline curves for  oil  or gas pro-
                    duction consists of  plotting the log of  flow rate versus time on semilog paper.
                    In cases for a decline in rate of  production, the data are extrapolated into the
                    future to provide an estimate of  expected production and reserves.
                      The empirical relationships for the analysis of  production decline curves were
                    first  proposed by Arps  [255] in which  a  decline rate,  a,  was defined  as the
                    fractional change in the flow rate, q,  with time, t:


                                                                                  (5-181)

                    If  time is in days, flow rate in this equation is expressed in terms of  stock tank
                    barrels per day in the case of oil and scf per day for gas.  Other consistent units
                    of  flow rate and time can be  used. As shown in Figure 5-145, three  types of
                    decline can occur: a constant percentage or exponential decline, a hyperbolic
                    decline, and a harmonic decline [245].  For the semilog plot,  the exponential
                    decline is  a  straight line whereas the  slopes of  the  hyperbolic and harmonic
                    decline curves decrease with  time.  For  the  exponential decline, the  drop in
                    production per  unit time is a constant fraction of  the produttion rate.  For  a
                    hyperbolic decline, the decrease in production per  unit  time as a fraction of
                    the production rate is proportional to a fractional power (between 0 and 1) of
   270   271   272   273   274   275   276   277   278   279   280