
Page 533 - Standard Handbook Petroleum Natural Gas Engineering VOLUME2
P. 533
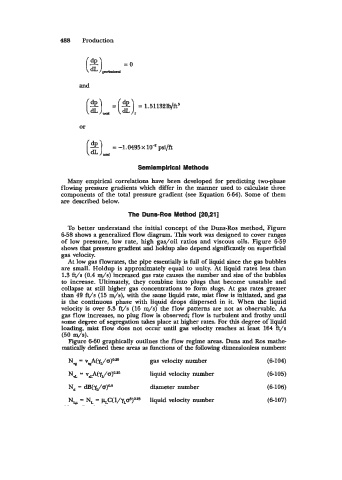
488    Production


                         and

                           (%)&            = 1.51132Wft'


                         or
                           (%)     = -1.0495~10~psi/ft

                                told

                                          Semiemplrlcal Methods
                     Many empirical correlations have  been  developed for predicting two-phase
                   flowing pressure gradients which  differ in the manner used to calculate three
                   components of  the total pressure gradient (see Equation 6-64). Some of  them
                   are described below.
                                       The Duns-Ros Method [20,21]

                     To better understand  the initial  concept of the Duns-Ros method,  Figure
                   6-58 shows a generalized flow diagram. This work was designed to cover ranges
                   of  low pressure,  low rate,  high  gas/oil  ratios and viscous oils. Figure  6-59
                   shows that pressure gradient and holdup also depend significantlr  on superficial
                   gas velocity.
                     At low gas flowrates, the pipe essentially is full of  liquid since the gas bubbles
                   are small. Holdup is approximately equal to unity. At liquid rates  less than
                    1.3 ft/s  (0.4 4s) increased gas rate causes the number and size of the bubbles
                   to  increase.  Ultimately,  they  combine into plugs  that become unstable  and
                   collapse at still higher  gas concentrations to form slugs. At  gas rates greater
                   than 49 ft/s  (15 m/s), with the same liquid rate, mist flow is initiated, and gas
                   is  the  continuous phase  with liquid  drops dispersed in it.  When  the liquid
                   velocity is  over 5.3  ft/s  (16 m/s)  the flow patterns are not  as observable. As
                    gas flow increases, no plug flaw is observed; flow is turbulent and frothy until
                    some degree of segregation takes place at higher rates. For this degree of liquid
                    loading, mist flow does not  occur until gas velocity reaches at least  164 ft/s
                    (50 WS).
                      Figure 6-60 graphically outlines the flow regime areas.  Duns and Ros mathe
                    matically defied these areas as functions of the following dimensionless numbers:

                      N,  = v,A(*IJa)OS       gas velocity number                (6-104)
                      NvL = V,A(YJQ)~."       liquid velocity number             (6105)

                      Nd = dB(~Jf3)~~         diameter number                    (6-106)
                      N,   = N, = ~C(l/yL&)os  liquid velocity number            (6-107)