
Page 249 - Statistics for Dummies
P. 249
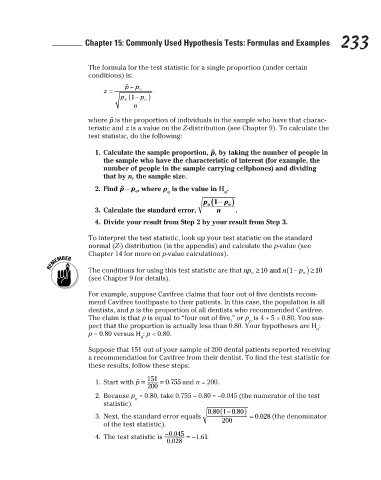
The formula for the test statistic for a single proportion (under certain
                                                    conditions) is:
                                                    where   is the proportion of individuals in the sample who have that charac-
                                                    teristic and z is a value on the Z-distribution (see Chapter 9). To calculate the
                                                    test statistic, do the following:
                                                      1. Calculate the sample proportion,  , by taking the number of people in
                                                        the sample who have the characteristic of interest (for example, the
                                                        number of people in the sample carrying cellphones) and dividing
                                                        that by n, the sample size.
                                                      2. Find
                                                                 , where p  is the value in H .
                                                                                          o
                                                                          o
                                                      3. Calculate the standard error,
                                                   Chapter 15: Commonly Used Hypothesis Tests: Formulas and Examples      233
                                                                                             .
                                                      4. Divide your result from Step 2 by your result from Step 3.
                                                    To interpret the test statistic, look up your test statistic on the standard
                                                    normal (Z-) distribution (in the appendix) and calculate the p-value (see
                                                    Chapter 14 for more on p-value calculations).
                                                   The conditions for using this test statistic are that
                                                    (see Chapter 9 for details).
                                                    For example, suppose Cavifree claims that four out of five dentists recom-
                                                    mend Cavifree toothpaste to their patients. In this case, the population is all
                                                    dentists, and p is the proportion of all dentists who recommended Cavifree.
                                                    The claim is that p is equal to “four out of five,” or p  is 4 ÷ 5 = 0.80. You sus-
                                                                                                o
                                                    pect that the proportion is actually less than 0.80. Your hypotheses are H :
                                                                                                                   o
                                                    p = 0.80 versus H : p < 0.80.
                                                                  a
                                                    Suppose that 151 out of your sample of 200 dental patients reported receiving
                                                    a recommendation for Cavifree from their dentist. To find the test statistic for
                                                    these results, follow these steps:
                                                      1. Start with           and n = 200.
                                                      2. Because p  = 0.80, take 0.755 – 0.80 = –0.045 (the numerator of the test
                                                                 o
                                                          statistic).
                                                      3.  Next, the standard error equals              (the denominator
                                                        of the test statistic).
                                                      4.  The test statistic is      .


                                                                                                                           3/25/11   8:14 PM
                             22_9780470911082-ch15.indd   233
                             22_9780470911082-ch15.indd   233                                                              3/25/11   8:14 PM