
Page 32 - Successful Onboarding
P. 32
The Business Case for Onboarding • 21
I
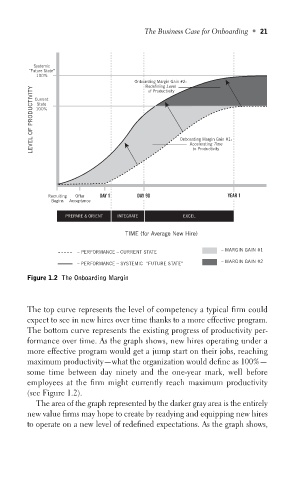
Figure 1.2 The Onboarding Margin
The top curve represents the level of competency a typical firm could
expect to see in new hires over time thanks to a more effective program.
The bottom curve represents the existing progress of productivity per-
formance over time. As the graph shows, new hires operating under a
more effective program would get a jump start on their jobs, reaching
maximum productivity—what the organization would define as 100%—
some time between day ninety and the one-year mark, well before
employees at the firm might currently reach maximum productivity
(see Figure 1.2).
The area of the graph represented by the darker gray area is the entirely
new value firms may hope to create by readying and equipping new hires
to operate on a new level of redefined expectations. As the graph shows,