
Page 197 - Sustainability in the process industry
P. 197
174 Cha p te r E i g h t
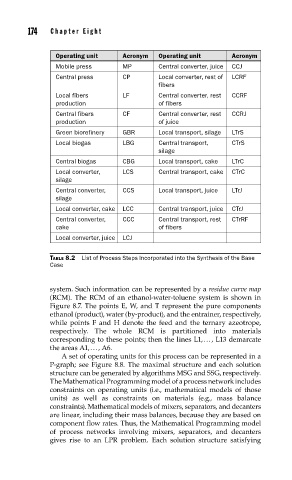
Operating unit Acronym Operating unit Acronym
Mobile press MP Central converter, juice CCJ
Central press CP Local converter, rest of LCRF
fibers
Local fibers LF Central converter, rest CCRF
production of fibers
Central fibers CF Central converter, rest CCRJ
production of juice
Green biorefinery GBR Local transport, silage LTrS
Local biogas LBG Central transport, CTrS
silage
Central biogas CBG Local transport, cake LTrC
Local converter, LCS Central transport, cake CTrC
silage
Central converter, CCS Local transport, juice LTrJ
silage
Local converter, cake LCC Central transport, juice CTrJ
Central converter, CCC Central transport, rest CTrRF
cake of fibers
Local converter, juice LCJ
TABLE 8.2 List of Process Steps Incorporated into the Synthesis of the Base
Case
system. Such information can be represented by a residue curve map
(RCM). The RCM of an ethanol-water-toluene system is shown in
Figure 8.7. The points E, W, and T represent the pure components
ethanol (product), water (by-product), and the entrainer, respectively,
while points F and H denote the feed and the ternary azeotrope,
respectively. The whole RCM is partitioned into materials
corresponding to these points; then the lines L1, . . . , L13 demarcate
the areas A1, . . . , A6.
A set of operating units for this process can be represented in a
P-graph; see Figure 8.8. The maximal structure and each solution
structure can be generated by algorithms MSG and SSG, respectively.
The Mathematical Programming model of a process network includes
constraints on operating units (i.e., mathematical models of those
units) as well as constraints on materials (e.g., mass balance
constraints). Mathematical models of mixers, separators, and decanters
are linear, including their mass balances, because they are based on
component flow rates. Thus, the Mathematical Programming model
of process networks involving mixers, separators, and decanters
gives rise to an LPR problem. Each solution structure satisfying