
Page 215 - Sustainability in the process industry
P. 215
192 Cha p te r N i n e
finding the optimal structure of a process system, and this includes
determining optimal types, configurations, and capacities of the
units that perform various operations within the system. The details
of the process graph (P-graph) approach were presented in Chapters 7
and 8. Process network synthesis is sometimes called flowsheeting
or flowsheet optimization because it involves the creation of a
flowsheet for the industrial process under consideration.
In order to solve a PNS problem, the designer must examine all
feasible structures and select the best among them. The structure’s
optimality can be assessed in terms of cost, profit, efficiency, and so
on. When designing an optimal process network, both structural
information (which processing units are connected, and how) and
sizing information (how much is produced from a given material)
are needed.
The questions addressed by PNS Solutions are as follows:
(1) How are the building blocks of a process network best represented?
(2) What are the possible solution structures of the problem? (3) What
is the maximal structure (which includes all solution structures)?
(4) What is the optimal structure?
The maximal structure comprises all the combinatorially feasible
structures capable of yielding the specified products from the
specified raw materials. Certainly, the optimal network or structure
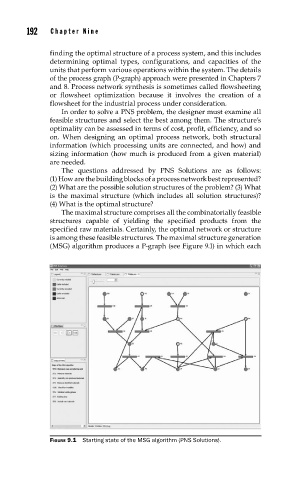
is among these feasible structures. The maximal structure generation
(MSG) algorithm produces a P-graph (see Figure 9.1) in which each
FIGURE 9.1 Starting state of the MSG algorithm (PNS Solutions).