
Page 476 - Sustainable Cities and Communities Design Handbook
P. 476
446 Sustainable Cities and Communities Design Handbook
HIROSAKI SMART CITY
The aforementioned evidence on policy integration, finance, and other factors
indicates that the diffusion of Japan’s smart communities is primed to accel-
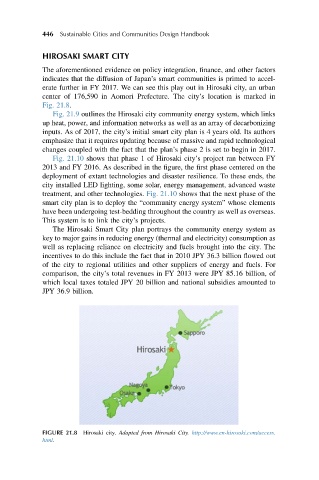
erate further in FY 2017. We can see this play out in Hirosaki city, an urban
center of 176,590 in Aomori Prefecture. The city’s location is marked in
Fig. 21.8.
Fig. 21.9 outlines the Hirosaki city community energy system, which links
up heat, power, and information networks as well as an array of decarbonizing
inputs. As of 2017, the city’s initial smart city plan is 4 years old. Its authors
emphasize that it requires updating because of massive and rapid technological
changes coupled with the fact that the plan’s phase 2 is set to begin in 2017.
Fig. 21.10 shows that phase 1 of Hirosaki city’s project ran between FY
2013 and FY 2016. As described in the figure, the first phase centered on the
deployment of extant technologies and disaster resilience. To these ends, the
city installed LED lighting, some solar, energy management, advanced waste
treatment, and other technologies. Fig. 21.10 shows that the next phase of the
smart city plan is to deploy the “community energy system” whose elements
have been undergoing test-bedding throughout the country as well as overseas.
This system is to link the city’s projects.
The Hirosaki Smart City plan portrays the community energy system as
key to major gains in reducing energy (thermal and electricity) consumption as
well as replacing reliance on electricity and fuels brought into the city. The
incentives to do this include the fact that in 2010 JPY 36.3 billion flowed out
of the city to regional utilities and other suppliers of energy and fuels. For
comparison, the city’s total revenues in FY 2013 were JPY 85.16 billion, of
which local taxes totaled JPY 20 billion and national subsidies amounted to
JPY 36.9 billion.
FIGURE 21.8 Hirosaki city. Adapted from Hirosaki City. http://www.en-hirosaki.com/access.
html.