
Page 167 -
P. 167
134 Part 2 • InformatIon requIrements analysIs
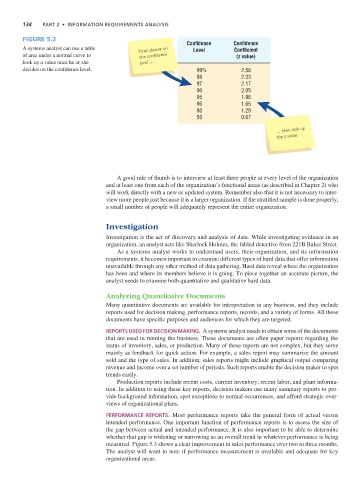
Figure 5.2
Confidence Confidence
A systems analyst can use a table First decide on Level Coefficient
of area under a normal curve to the confidence (z value)
look up a value once he or she level …
decides on the confidence level. 99% 2.58
98 2.33
97 2.17
96 2.05
95 1.96
90 1.65
80 1.28
50 0.67
… then look up
the z value.
A good rule of thumb is to interview at least three people at every level of the organization
and at least one from each of the organization’s functional areas (as described in Chapter 2) who
will work directly with a new or updated system. Remember also that it is not necessary to inter-
view more people just because it is a larger organization. If the stratified sample is done properly,
a small number of people will adequately represent the entire organization.
Investigation
Investigation is the act of discovery and analysis of data. While investigating evidence in an
organization, an analyst acts like Sherlock Holmes, the fabled detective from 221B Baker Street.
As a systems analyst works to understand users, their organization, and its information
requirements, it becomes important to examine different types of hard data that offer information
unavailable through any other method of data gathering. Hard data reveal where the organization
has been and where its members believe it is going. To piece together an accurate picture, the
analyst needs to examine both quantitative and qualitative hard data.
Analyzing Quantitative Documents
Many quantitative documents are available for interpretation in any business, and they include
reports used for decision making, performance reports, records, and a variety of forms. All these
documents have specific purposes and audiences for which they are targeted.
REPORTS USED FOR DECISION MAKING. A systems analyst needs to obtain some of the documents
that are used in running the business. These documents are often paper reports regarding the
status of inventory, sales, or production. Many of these reports are not complex, but they serve
mainly as feedback for quick action. For example, a sales report may summarize the amount
sold and the type of sales. In addition, sales reports might include graphical output comparing
revenue and income over a set number of periods. Such reports enable the decision maker to spot
trends easily.
Production reports include recent costs, current inventory, recent labor, and plant informa-
tion. In addition to using these key reports, decision makers use many summary reports to pro-
vide background information, spot exceptions to normal occurrences, and afford strategic over-
views of organizational plans.
PERFORMANCE REPORTS. Most performance reports take the general form of actual versus
intended performance. One important function of performance reports is to assess the size of
the gap between actual and intended performance. It is also important to be able to determine
whether that gap is widening or narrowing as an overall trend in whatever performance is being
measured. Figure 5.3 shows a clear improvement in sales performance over two to three months.
The analyst will want to note if performance measurement is available and adequate for key
organizational areas.