
Page 84 - TPM A Route to World-Class Performance
P. 84
Techniques to deliver the TPM principles 65
There are difficulties in implementing TPM in every country, including
Japan. As this is the country with the most experience, the TPM implementation
process is at its most mature in Japan. Naturally, this is an evolving situation
as more non-Japanese companies achieve 'world-class' TPM applications.
The three-cycle TPM improvement plan was developed to deal with the need
to:
progressively build management commitment and consensus based on
results;
0 build on existing good working practices;
0 produce rapid results;
get buy-in to new ideas across international boundaries.
Within the rigour of the three-cycle, nine-step process, it provides the
flexibility to build on strengths and reduce weaknesses. In this way, it builds
on the principles rather than diluting their undoubted synergy.
Let us now take a closer look at each of the five Nakajima TPM principles,
together with the measurement, condition and problem prevention of the
TPM improvement plan (Figure 4.1).
4.1 First principle: Continuous
improvement in OEE
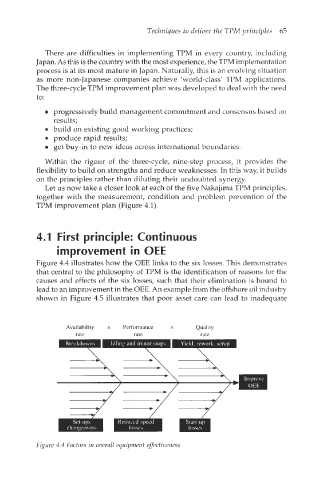
Figure 4.4 illustrates how the OEE links to the six losses. This demonstrates
that central to the philosophy of TPM is the identification of reasons for the
causes and effects of the six losses, such that their elimination is bound to
lead to an improvement in the OEE. An example from the offshore oil industry
shown in Figure 4.5 illustrates that poor asset care can lead to inadequate
Availability x Performance x Quality
rate rate rate
,7 -/ ---7
Figure 4.4 Factors in overall equipment effectiveness