
Page 399 - Tandem Techniques
P. 399
Page 383
through the skimmer plates into the mass spectrometer source. This interface system can operate at flow
rates of a few microliters a minute and are thus ideally suited for micro column chromatography. An
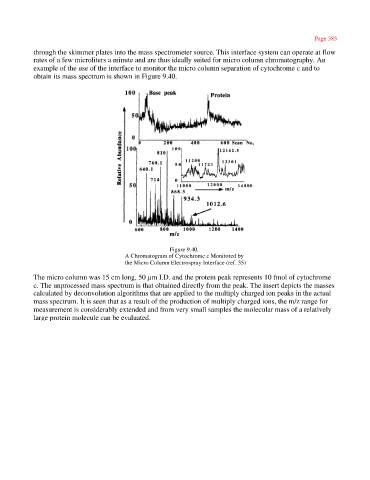
example of the use of the interface to monitor the micro column separation of cytochrome c and to
obtain its mass spectrum is shown in Figure 9.40.
Figure 9.40.
A Chromatogram of Cytochrome c Monitored by
the Micro Column Electrospray Interface (ref. 35)
The micro column was 15 cm long, 50 µm I.D. and the protein peak represents 10 fmol of cytochrome
c. The unprocessed mass spectrum is that obtained directly from the peak. The insert depicts the masses
calculated by deconvolution algorithms that are applied to the multiply charged ion peaks in the actual
mass spectrum. It is seen that as a result of the production of multiply charged ions, the m/z range for
measurement is considerably extended and from very small samples the molecular mass of a relatively
large protein molecule can be evaluated.