
Page 468 - Tandem Techniques
P. 468
Page 452
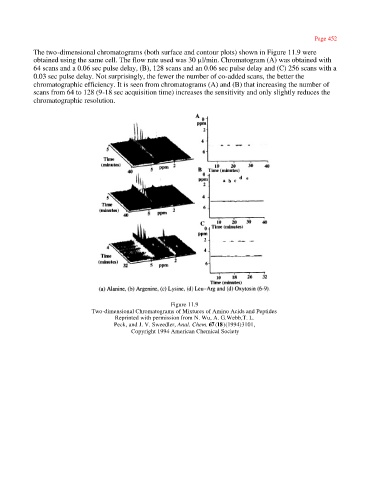
The two-dimensional chromatograms (both surface and contour plots) shown in Figure 11.9 were
obtained using the same cell. The flow rate used was 30 µl/min. Chromatogram (A) was obtained with
64 scans and a 0.06 sec pulse delay, (B), 128 scans and an 0.06 sec pulse delay and (C) 256 scans with a
0.03 sec pulse delay. Not surprisingly, the fewer the number of co-added scans, the better the
chromatographic efficiency. It is seen from chromatograms (A) and (B) that increasing the number of
scans from 64 to 128 (9-18 sec acquisition time) increases the sensitivity and only slightly reduces the
chromatographic resolution.
Figure 11.9
Two-dimensional Chromatograms of Mixtures of Amino Acids and Peptides
Reprinted with permission from N. Wu, A. G.Webb,T. L.
Peck, and J. V. Sweedler, Anal. Chem. 67(18)(1994)3101,
Copyright 1994 American Chemical Society