
Page 80 - Teach Yourself Electricity and Electronics
P. 80
60 Measuring devices
Technicians and engineers develop a sense of what a signal waveform should look
like, and then they can often tell, by observing the oscilloscope display, whether or not
the circuit under test is behaving the way it should. This is a subjective kind of
“measurement, “ since it is qualitative as well as quantitative. If a wave shape “looks
wrong,” it might indicate distortion in a circuit, or possibly even betray a burned-out
component someplace.
Bar-graph meters
A cheap, simple kind of meter can be made using a string of light-emitting diodes (LEDs)
or a liquid-crystal display (LCD) along with a digital scale, to indicate approximate levels
of current, voltage or power. This type of meter has no moving parts to break, just like a
digital meter. But it also offers the relative-reading feeling you get with an analog meter.
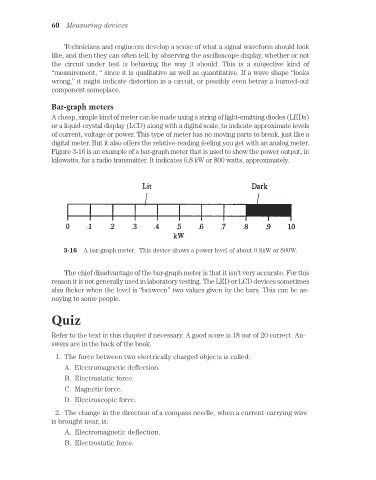
Figure 3-16 is an example of a bar-graph meter that is used to show the power output, in
kilowatts, for a radio transmitter. It indicates 0.8 kW or 800 watts, approximately.
3-16 A bar-graph meter. This device shows a power level of about 0.8kW or 800W.
The chief disadvantage of the bar-graph meter is that it isn’t very accurate. For this
reason it is not generally used in laboratory testing. The LED or LCD devices sometimes
also flicker when the level is “between” two values given by the bars. This can be an-
noying to some people.
Quiz
Refer to the text in this chapter if necessary. A good score is 18 out of 20 correct. An-
swers are in the back of the book.
1. The force between two electrically charged objects is called:
A. Electromagnetic deflection.
B. Electrostatic force.
C. Magnetic force.
D. Electroscopic force.
2. The change in the direction of a compass needle, when a current-carrying wire
is brought near, is:
A. Electromagnetic deflection.
B. Electrostatic force.