
Page 122 - Bruce Ellig - The Complete Guide to Executive Compensation (2007)
P. 122
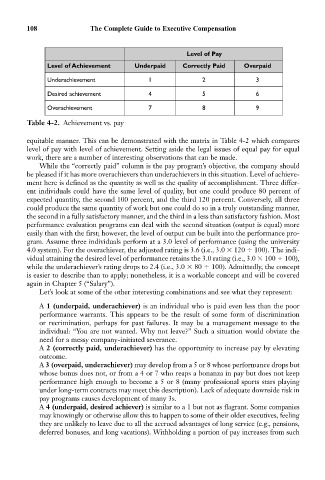
108               The Complete Guide to Executive Compensation


                                                         Level of Pay
                 Level of Achievement     Underpaid     Correctly Paid    Overpaid

                 Underachievement             1               2              3
                 Desired achievement          4               5              6

                 Overachievement              7               8              9
            Table 4-2. Achievement vs. pay


            equitable manner. This can be demonstrated with the matrix in Table 4-2 which compares
            level of pay with level of achievement. Setting aside the legal issues of equal pay for equal
            work, there are a number of interesting observations that can be made.
               While the “correctly paid” column is the pay program’s objective, the company should
            be pleased if it has more overachievers than underachievers in this situation. Level of achieve-
            ment here is defined as the quantity as well as the quality of accomplishment. Three differ-
            ent individuals could have the same level of quality, but one could produce 80 percent of
            expected quantity, the second 100 percent, and the third 120 percent. Conversely, all three
            could produce the same quantity of work but one could do so in a truly outstanding manner,
            the second in a fully satisfactory manner, and the third in a less than satisfactory fashion. Most
            performance evaluation programs can deal with the second situation (output is equal) more
            easily than with the first; however, the level of output can be built into the performance pro-
            gram. Assume three individuals perform at a 3.0 level of performance (using the university
            4.0 system). For the overachiever, the adjusted rating is 3.6 (i.e., 3.0   120   100). The indi-
            vidual attaining the desired level of performance retains the 3.0 rating (i.e., 3.0   100   100),
            while the underachiever’s rating drops to 2.4 (i.e., 3.0   80   100). Admittedly, the concept
            is easier to describe than to apply; nonetheless, it is a workable concept and will be covered
            again in Chapter 5 (“Salary”).
               Let’s look at some of the other interesting combinations and see what they represent:
               A 1 (underpaid, underachiever) is an individual who is paid even less than the poor
               performance warrants. This appears to be the result of some form of discrimination
               or recrimination, perhaps for past failures. It may be a management message to the
               individual: “You are not wanted. Why not leave?” Such a situation would obviate the
               need for a messy company-initiated severance.
               A 2 (correctly paid, underachiever) has the opportunity to increase pay by elevating
               outcome.
               A 3 (overpaid, underachiever) may develop from a 5 or 8 whose performance drops but
               whose bonus does not, or from a 4 or 7 who reaps a bonanza in pay but does not keep
               performance high enough to become a 5 or 8 (many professional sports stars playing
               under long-term contracts may meet this description). Lack of adequate downside risk in
               pay programs causes development of many 3s.
               A 4 (underpaid, desired achiever) is similar to a 1 but not as flagrant. Some companies
               may knowingly or otherwise allow this to happen to some of their older executives, feeling
               they are unlikely to leave due to all the accrued advantages of long service (e.g., pensions,
               deferred bonuses, and long vacations). Withholding a portion of pay increases from such