
Page 23 - Bruce Ellig - The Complete Guide to Executive Compensation (2007)
P. 23
Chapter 1. Executive Compensation Framework 9
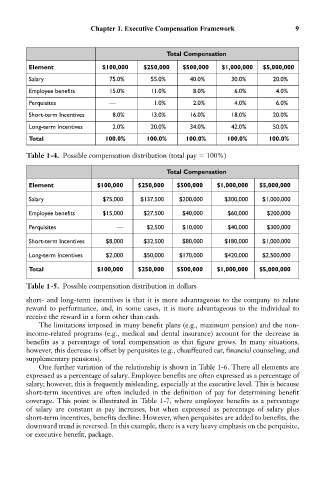
Total Compensation
Element $100,000 $250,000 $500,000 $1,000,000 $5,000,000
Salary 75.0% 55.0% 40.0% 30.0% 20.0%
Employee benefits 15.0% 11.0% 8.0% 6.0% 4.0%
Perquisites — 1.0% 2.0% 4.0% 6.0%
Short-term Incentives 8.0% 13.0% 16.0% 18.0% 20.0%
Long-term Incentives 2.0% 20.0% 34.0% 42.0% 50.0%
Total 100.0% 100.0% 100.0% 100.0% 100.0%
Table 1-4. Possible compensation distribution (total pay 100%)
Total Compensation
Element $100,000 $250,000 $500,000 $1,000,000 $5,000,000
Salary $75,000 $137,500 $200,000 $300,000 $1,000,000
Employee benefits $15,000 $27,500 $40,000 $60,000 $200,000
Perquisites — $2,500 $10,000 $40,000 $300,000
Short-term Incentives $8,000 $32,500 $80,000 $180,000 $1,000,000
Long-term Incentives $2,000 $50,000 $170,000 $420,000 $2,500,000
Total $100,000 $250,000 $500,000 $1,000,000 $5,000,000
Table 1-5. Possible compensation distribution in dollars
short- and long-term incentives is that it is more advantageous to the company to relate
reward to performance, and, in some cases, it is more advantageous to the individual to
receive the reward in a form other than cash.
The limitations imposed in many benefit plans (e.g., maximum pension) and the non-
income-related programs (e.g., medical and dental insurance) account for the decrease in
benefits as a percentage of total compensation as that figure grows. In many situations,
however, this decrease is offset by perquisites (e.g., chauffeured car, financial counseling, and
supplementary pensions).
One further variation of the relationship is shown in Table 1-6. There all elements are
expressed as a percentage of salary. Employee benefits are often expressed as a percentage of
salary; however, this is frequently misleading, especially at the executive level. This is because
short-term incentives are often included in the definition of pay for determining benefit
coverage. This point is illustrated in Table 1-7, where employee benefits as a percentage
of salary are constant as pay increases, but when expressed as percentage of salary plus
short-term incentives, benefits decline. However, when perquisites are added to benefits, the
downward trend is reversed. In this example, there is a very heavy emphasis on the perquisite,
or executive benefit, package.