
Page 338 - Bruce Ellig - The Complete Guide to Executive Compensation (2007)
P. 338
324 The Complete Guide to Executive Compensation
Annual Compound Growth
Pay Increase Percent 5% 10% 15%
30 Years
15% $2,436,912 $4,022,896 $7,448,824
10% 1,033,788 1,963,058 4,205,755
5% 466,219 1,083,016 2,668,999
20 Years
15% $539,959 $795,221 $1,227,490
10% 320,844 504,563 831,367
5% 198,997 336,122 591,384
10 Years
15% $95,156 $119,775 $151,709
10% 75,982 97,265 125,219
5% 61,084 79,600 104,219
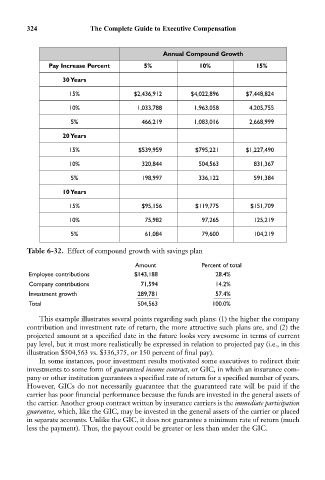
Table 6-32. Effect of compound growth with savings plan
Amount Percent of total
Employee contributions $143,188 28.4%
Company contributions 71,594 14.2%
Investment growth 289,781 57.4%
Total 504,563 100.0%
This example illustrates several points regarding such plans: (1) the higher the company
contribution and investment rate of return, the more attractive such plans are, and (2) the
projected amount at a specified date in the future looks very awesome in terms of current
pay level, but it must more realistically be expressed in relation to projected pay (i.e., in this
illustration $504,563 vs. $336,375, or 150 percent of final pay).
In some instances, poor investment results motivated some executives to redirect their
investments to some form of guaranteed income contract, or GIC, in which an insurance com-
pany or other institution guarantees a specified rate of return for a specified number of years.
However, GICs do not necessarily guarantee that the guaranteed rate will be paid if the
carrier has poor financial performance because the funds are invested in the general assets of
the carrier. Another group contract written by insurance carriers is the immediate participation
guarantee, which, like the GIC, may be invested in the general assets of the carrier or placed
in separate accounts. Unlike the GIC, it does not guarantee a minimum rate of return (much
less the payment). Thus, the payout could be greater or less than under the GIC.