
Page 35 - Bruce Ellig - The Complete Guide to Executive Compensation (2007)
P. 35
Chapter 1. Executive Compensation Framework 21
Emphasis In
Pay Element Old Economy New Economy
Salary High Low
Employee benefits Moderate Low
Perquisites Moderate Low
Short-term incentives High Low
Long-term incentives stock options Low High
Other High Low
Table 1-10. Pay elements in new vs. old economy companies
of a combination maturity/decline phase (see Table 1-13). There are some exceptions, but
this is a typical view of where new and old economy companies are positioned in the
market cycle.
Old economy companies (positioned in maturity/decline) that attempt to change their
pay practices to more closely align with new economy companies are advised to use this
strategy to implement a turnaround, not simply to reformat pay practices.
Combination Lifecycles
Because companies have SBUs that may be in different stages of the lifecycle, programs must
be customized to reflect those differences. Programs should also reflect not only current
stages but also the future the company or which is positioning. Because of the fluidity of
changing events and resulting strategies, it is critical to continually review the composition
of a pay program to ensure it is consistent with objectives.
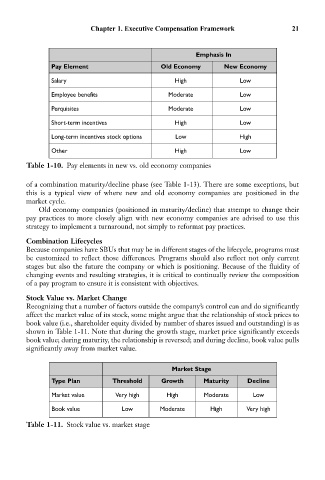
Stock Value vs. Market Change
Recognizing that a number of factors outside the company’s control can and do significantly
affect the market value of its stock, some might argue that the relationship of stock prices to
book value (i.e., shareholder equity divided by number of shares issued and outstanding) is as
shown in Table 1-11. Note that during the growth stage, market price significantly exceeds
book value; during maturity, the relationship is reversed; and during decline, book value pulls
significantly away from market value.
Market Stage
Type Plan Threshold Growth Maturity Decline
Market value Very high High Moderate Low
Book value Low Moderate High Very high
Table 1-11. Stock value vs. market stage