
Page 563 - Bruce Ellig - The Complete Guide to Executive Compensation (2007)
P. 563
Chapter 9. Design and Communication Considerations 549
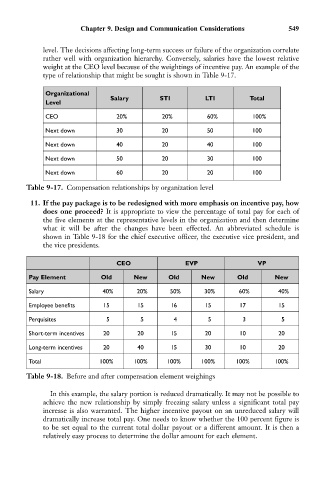
level. The decisions affecting long-term success or failure of the organization correlate
rather well with organization hierarchy. Conversely, salaries have the lowest relative
weight at the CEO level because of the weightings of incentive pay. An example of the
type of relationship that might be sought is shown in Table 9-17.
Organizational
Salary STI LTI Total
Level
CEO 20% 20% 60% 100%
Next down 30 20 50 100
Next down 40 20 40 100
Next down 50 20 30 100
Next down 60 20 20 100
Table 9-17. Compensation relationships by organization level
11. If the pay package is to be redesigned with more emphasis on incentive pay, how
does one proceed? It is appropriate to view the percentage of total pay for each of
the five elements at the representative levels in the organization and then determine
what it will be after the changes have been effected. An abbreviated schedule is
shown in Table 9-18 for the chief executive officer, the executive vice president, and
the vice presidents.
CEO EVP VP
Pay Element Old New Old New Old New
Salary 40% 20% 50% 30% 60% 40%
Employee benefits 15 15 16 15 17 15
Perquisites 5 5 4 5 3 5
Short-term incentives 20 20 15 20 10 20
Long-term incentives 20 40 15 30 10 20
Total 100% 100% 100% 100% 100% 100%
Table 9-18. Before and after compensation element weighings
In this example, the salary portion is reduced dramatically. It may not be possible to
achieve the new relationship by simply freezing salary unless a significant total pay
increase is also warranted. The higher incentive payout on an unreduced salary will
dramatically increase total pay. One needs to know whether the 100 percent figure is
to be set equal to the current total dollar payout or a different amount. It is then a
relatively easy process to determine the dollar amount for each element.