
Page 236 - Harnessing the Management Secrets of Disney in Your Company
P. 236
Re-Creating the Magic 217
Disney 4,000%
Performance 1984–2006 3/16/06
3,500%
3,000%
2,500%
Disney
2,000%
1,500%
1,000%
S&P 500 500%
0%
84 86 88 90 92 94 96 98 00 02 04
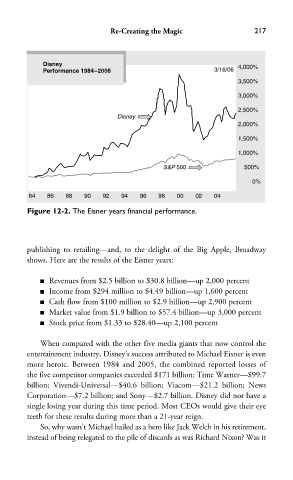
Figure 12-2. The Eisner years financial performance.
publishing to retailing—and, to the delight of the Big Apple, Broadway
shows. Here are the results of the Eisner years:
■ Revenues from $2.5 billion to $30.8 billion—up 2,000 percent
■ Income from $294 million to $4.49 billion—up 1,600 percent
■ Cash flow from $100 million to $2.9 billion—up 2,900 percent
■ Market value from $1.9 billion to $57.4 billion—up 3,000 percent
■ Stock price from $1.33 to $28.40—up 2,100 percent
When compared with the other five media giants that now control the
entertainment industry, Disney’s success attributed to Michael Eisner is even
more heroic. Between 1984 and 2005, the combined reported losses of
the five competitor companies exceeded $171 billion: Time Warner—$99.7
billion; Vivendi-Universal—$40.6 billion; Viacom—$21.2 billion; News
Corporation—$7.2 billion; and Sony—$2.7 billion. Disney did not have a
single losing year during this time period. Most CEOs would give their eye
teeth for these results during more than a 21-year reign.
So, why wasn’t Michael hailed as a hero like Jack Welch in his retirement,
instead of being relegated to the pile of discards as was Richard Nixon? Was it