
Page 181 - The Engineering Guide to LEED-New Construction Sustainable Construction for Engineers
P. 181
LEED Ener gy and Atmospher e 159
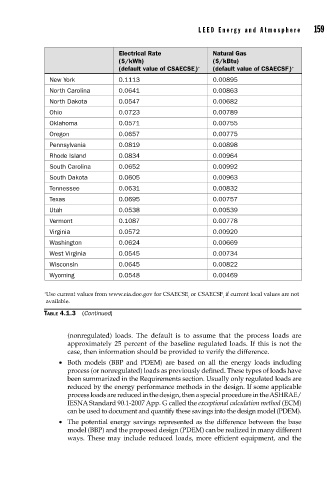
Electrical Rate Natural Gas
($/kWh) ($/kBtu)
(default value of CSAECSE) ∗ (default value of CSAECSF) ∗
i i
New York 0.1113 0.00895
North Carolina 0.0641 0.00863
North Dakota 0.0547 0.00682
Ohio 0.0723 0.00789
Oklahoma 0.0571 0.00755
Oregon 0.0657 0.00775
Pennsylvania 0.0819 0.00898
Rhode Island 0.0834 0.00964
South Carolina 0.0652 0.00992
South Dakota 0.0605 0.00963
Tennessee 0.0631 0.00832
Texas 0.0695 0.00757
Utah 0.0538 0.00539
Vermont 0.1087 0.00778
Virginia 0.0572 0.00920
Washington 0.0624 0.00669
West Virginia 0.0545 0.00734
Wisconsin 0.0645 0.00822
Wyoming 0.0548 0.00469
∗ Use current values from www.eia.doe.gov for CSAECSE or CSAECSF if current local values are not
i i
available.
TABLE 4.1.3 (Continued)
(nonregulated) loads. The default is to assume that the process loads are
approximately 25 percent of the baseline regulated loads. If this is not the
case, then information should be provided to verify the difference.
• Both models (BBP and PDEM) are based on all the energy loads including
process (or nonregulated) loads as previously defined. These types of loads have
been summarized in the Requirements section. Usually only regulated loads are
reduced by the energy performance methods in the design. If some applicable
process loads are reduced in the design, then a special procedure in the ASHRAE/
IESNA Standard 90.1-2007 App. G called the exceptional calculation method (ECM)
can be used to document and quantify these savings into the design model (PDEM).
• The potential energy savings represented as the difference between the base
model (BBP) and the proposed design (PDEM) can be realized in many different
ways. These may include reduced loads, more efficient equipment, and the