
Page 189 - The Engineering Guide to LEED-New Construction Sustainable Construction for Engineers
P. 189
LEED Ener gy and Atmospher e 167
The credit gives points based on the percent of an anticipated on-site energy usage
that is provided by the eligible on-site renewable sources as listed in Table 4.2.1. As
noted in EAc1, these energy cost savings are referred to as the renewable energy costs
(RECs) and are given in dollars per year. They are virtual savings using the on-site
energy generated times the applicable local or state average energy cost rate, as defined
in EAc1.
The denominator in the eligibility equations is more complex. If Option 1 of EAc1 is
sought, then the denominator is the proposed design energy model (PDEM). (It was the
PBP for EAc1 Option 1 cases originally in earlier versions.) If not, then the denominator
is the building annual energy cost (BAEC) and is calculated using the local energy rates
(CSAECSE and CSAECSF ), or if current local values are not available, the U.S.
i i
Department of Energy (DOE) Energy Information Administration (EIA) Commercial
Sector Average Energy Costs by State available from www.eia.doe.gov (the 2003 values
are listed in Table 4.1.2 in the EAc1 section) along with default energy consumption of
both electricity and nonelectrical fuel usage rates per square foot of the building, based
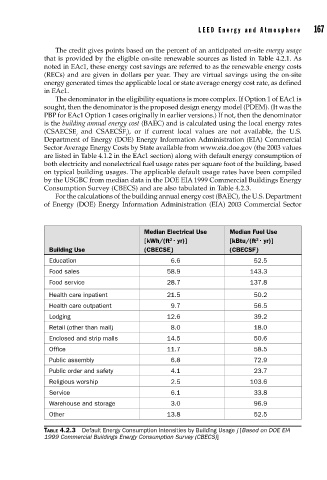
on typical building usages. The applicable default usage rates have been compiled
by the USGBC from median data in the DOE EIA 1999 Commercial Buildings Energy
Consumption Survey (CBECS) and are also tabulated in Table 4.2.3.
For the calculations of the building annual energy cost (BAEC), the U.S. Department
of Energy (DOE) Energy Information Administration (EIA) 2003 Commercial Sector
Median Electrical Use Median Fuel Use
2 .
2 .
[kWh/(ft yr)] [kBtu/(ft yr)]
Building Use (CBECSE) (CBECSF)
j j
Education 6.6 52.5
Food sales 58.9 143.3
Food service 28.7 137.8
Health care inpatient 21.5 50.2
Health care outpatient 9.7 56.5
Lodging 12.6 39.2
Retail (other than mall) 8.0 18.0
Enclosed and strip malls 14.5 50.6
Office 11.7 58.5
Public assembly 6.8 72.9
Public order and safety 4.1 23.7
Religious worship 2.5 103.6
Service 6.1 33.8
Warehouse and storage 3.0 96.9
Other 13.8 52.5
TABLE 4.2.3 Default Energy Consumption Intensities by Building Usage j [Based on DOE EIA
1999 Commercial Buildings Energy Consumption Survey (CBECS)]