
Page 207 - The Green Building Bottom Line The Real Cost of Sustainable Building
P. 207
EXISTING BUILDINGS 185
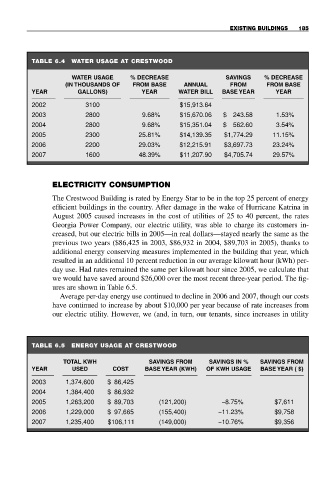
TABLE 6.4 WATER USAGE AT CRESTWOOD
WATER USAGE % DECREASE SAVINGS % DECREASE
(IN THOUSANDS OF FROM BASE ANNUAL FROM FROM BASE
YEAR GALLONS) YEAR WATER BILL BASE YEAR YEAR
2002 3100 $15,913.64
2003 2800 9.68% $15,670.06 $ 243.58 1.53%
2004 2800 9.68% $15,351.04 $ 562.60 3.54%
2005 2300 25.81% $14,139.35 $1,774.29 11.15%
2006 2200 29.03% $12,215.91 $3,697.73 23.24%
2007 1600 48.39% $11,207.90 $4,705.74 29.57%
ELECTRICITY CONSUMPTION
The Crestwood Building is rated by Energy Star to be in the top 25 percent of energy
efficient buildings in the country. After damage in the wake of Hurricane Katrina in
August 2005 caused increases in the cost of utilities of 25 to 40 percent, the rates
Georgia Power Company, our electric utility, was able to charge its customers in-
creased, but our electric bills in 2005—in real dollars—stayed nearly the same as the
previous two years ($86,425 in 2003, $86,932 in 2004, $89,703 in 2005), thanks to
additional energy conserving measures implemented in the building that year, which
resulted in an additional 10 percent reduction in our average kilowatt hour (kWh) per-
day use. Had rates remained the same per kilowatt hour since 2005, we calculate that
we would have saved around $26,000 over the most recent three-year period. The fig-
ures are shown in Table 6.5.
Average per-day energy use continued to decline in 2006 and 2007, though our costs
have continued to increase by about $10,000 per year because of rate increases from
our electric utility. However, we (and, in turn, our tenants, since increases in utility
TABLE 6.5 ENERGY USAGE AT CRESTWOOD
TOTAL KWH SAVINGS FROM SAVINGS IN % SAVINGS FROM
YEAR USED COST BASE YEAR (KWH) OF KWH USAGE BASE YEAR ( $)
2003 1,374,600 $ 86,425
2004 1,384,400 $ 86,932
2005 1,263,200 $ 89,703 (121,200) −8.75% $7,611
2006 1,229,000 $ 97,665 (155,400) −11.23% $9,758
2007 1,235,400 $106,111 (149,000) −10.76% $9,356