Page 103 - The Master Handbook Of Acoustics
P. 103

78   CHAPTER THREE


                                                                 It is especially bad when one works all
                   Table 3-2. OSHA permissible noise exposure  day in a high-noise environment, then
                   times.*                                    engages in motorcycle or automobile rac-
                   Sound pressure level,    Maximum daily     ing, listens to a 400-watt stereo at high
                   dB, A-weighting, slow      exposure        level, or spends hours in a discotheque.
                        response                hours         The professional audio engineer operating
                                                              with high monitoring levels is risking
                           85                16
                                                              irreparable injury to the basic tools of the
                           90                 8
                           92                 6               trade—his ears. As high-frequency loss
                           95                 4               creeps in, the volume control is turned up
                           97                 3               to compensate, and the rate of deteriora-
                          100                 2               tion is accelerated.
                          102                 1.5                The key to conservation of hearing is
                          105                 1               the audiogram. Comparing today’s audio-
                          110                 0.5             gram with earlier ones establishes the

                          115                 0.25 or less    trend; if downward, steps can be taken to
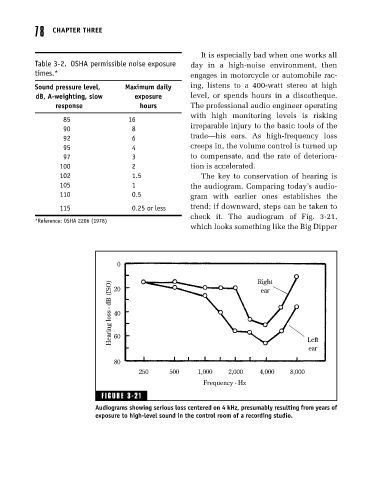
                                                              check it. The audiogram of Fig. 3-21,
                   *Reference: OSHA 2206 (1978)
                                                              which looks something like the Big Dipper


                                         0                                      Right

                                        Hearing loss - dB (ISO)  20              ear


                                         40


                                         60
                                                                                              Left
                                                                                               ear
                                         80
                                               250      500     1,000   2,000    4,000    8,000
                                                                 Frequency - Hz
                                     FIGURE 3-21
                                   Audiograms showing serious loss centered on 4 kHz, presumably resulting from years of
                                   exposure to high-level sound in the control room of a recording studio.
   98   99   100   101   102   103   104   105   106   107   108