
Page 121 - The Master Handbook Of Acoustics
P. 121
96 CHAPTER FIVE
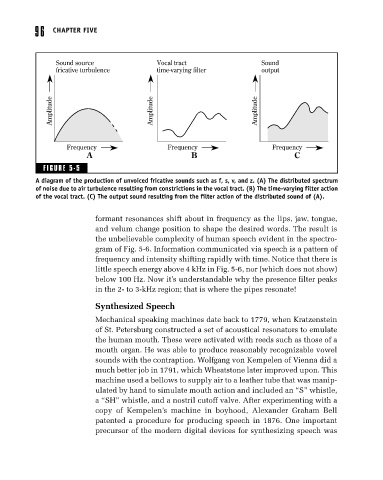
Sound source Vocal tract Sound
fricative turbulence time-varying filter output
Amplitude Amplitude Amplitude
Frequency Frequency Frequency
A B C
FIGURE 5-5
A diagram of the production of unvoiced fricative sounds such as f, s, v, and z. (A) The distributed spectrum
of noise due to air turbulence resulting from constrictions in the vocal tract. (B) The time-varying filter action
of the vocal tract. (C) The output sound resulting from the filter action of the distributed sound of (A).
formant resonances shift about in frequency as the lips, jaw, tongue,
and velum change position to shape the desired words. The result is
the unbelievable complexity of human speech evident in the spectro-
gram of Fig. 5-6. Information communicated via speech is a pattern of
frequency and intensity shifting rapidly with time. Notice that there is
little speech energy above 4 kHz in Fig. 5-6, nor (which does not show)
below 100 Hz. Now it’s understandable why the presence filter peaks
in the 2- to 3-kHz region; that is where the pipes resonate!
Synthesized Speech
Mechanical speaking machines date back to 1779, when Kratzenstein
of St. Petersburg constructed a set of acoustical resonators to emulate
the human mouth. These were activated with reeds such as those of a
mouth organ. He was able to produce reasonably recognizable vowel
sounds with the contraption. Wolfgang von Kempelen of Vienna did a
much better job in 1791, which Wheatstone later improved upon. This
machine used a bellows to supply air to a leather tube that was manip-
ulated by hand to simulate mouth action and included an “S” whistle,
a “SH” whistle, and a nostril cutoff valve. After experimenting with a
copy of Kempelen’s machine in boyhood, Alexander Graham Bell
patented a procedure for producing speech in 1876. One important
precursor of the modern digital devices for synthesizing speech was