
Page 156 - The Master Handbook Of Acoustics
P. 156
131
REVERBERATION
1.0.0
2.5 2.0.0
0.1.0 0.0.1
2.0 1.1.0 Untreated
Reverberation time - seconds 1.5 Treated
1.0
0.5
0
10 30 100 300 1 kHz 3 kHz 10 kHz
Frequency - Hz
FIGURE 7-1
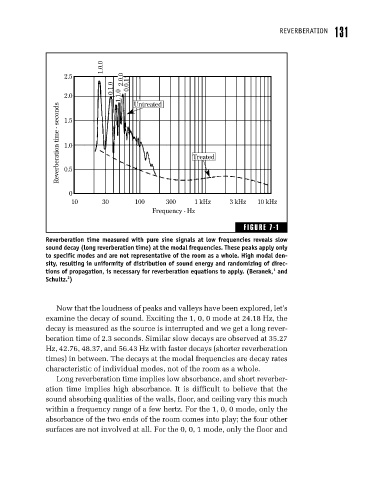
Reverberation time measured with pure sine signals at low frequencies reveals slow
sound decay (long reverberation time) at the modal frequencies. These peaks apply only
to specific modes and are not representative of the room as a whole. High modal den-
sity, resulting in uniformity of distribution of sound energy and randomizing of direc-
1
tions of propagation, is necessary for reverberation equations to apply. (Beranek, and
2
Schultz. )
Now that the loudness of peaks and valleys have been explored, let’s
examine the decay of sound. Exciting the 1, 0, 0 mode at 24.18 Hz, the
decay is measured as the source is interrupted and we get a long rever-
beration time of 2.3 seconds. Similar slow decays are observed at 35.27
Hz, 42.76, 48.37, and 56.43 Hz with faster decays (shorter reverberation
times) in between. The decays at the modal frequencies are decay rates
characteristic of individual modes, not of the room as a whole.
Long reverberation time implies low absorbance, and short reverber-
ation time implies high absorbance. It is difficult to believe that the
sound absorbing qualities of the walls, floor, and ceiling vary this much
within a frequency range of a few hertz. For the 1, 0, 0 mode, only the
absorbance of the two ends of the room comes into play; the four other
surfaces are not involved at all. For the 0, 0, 1 mode, only the floor and