
Page 102 - The Petroleum System From Source to Trap
P. 102
96 Peters and Cassa
Table 5.3. Geochemical Parameters Describing Level of Thermal Maturation
Maturation Generation
Stage of Thermal Ro Tmax Bitumen/ Bitumen PIC
Maturity for Oil (%) (OC) TAla TQCb (mglg rock) [S,/(S, + S2)l
Immature 0.2-0.6 <435 1 . 5-2.6 <0.05 <50 <0. 1 0
Mature
Early 0.6-0.65 435-445 2.6-2.7 0.05--Q.10 50-1 00 0.10--Q. 1 5
Peak 0.65-0.9 445-450 2.7-2.9 0.15--Q.25 1 5 Q--250 0.25--Q.40
Late 0.9-1 .35 45D-470 2.9-3.3 >0.40
Postmature >1.35 >470 >3.3
•TAl, thermal alteration index.
bMature oil-prone source rock with type I or II kerogen coornoly srow bittrneOC ratios in the range 0.05-{).25. Caution should be applied when in1erpreting extr yields
from coal. For example, many gas-prone coal show high extract yiel suggesng oil-e charcter, but extrct yield nonnaijzed to TOC is low ( <30 rng HC/g TOC).
BitumenfOC ratios over 0.25 can indicate contamination or migrated oil or can be artifacts caused by ratios of small, inaccurate numbers.
CPI, producli index.
genic methane) without significant heating due to
shallow burial By this definition, trapped methane and I Oil-Prone Thermal
nearby unconsolidated swamp muds from which it was /Maturation
derived represent a petroleum system. 1 . 5 Patnways
Criteria for describing the quantities of extractable Oil-Prone
u
organic matter in source rocks (Tables 5.1 and 5.3) can be .........
used to map the pod of active source rock where data are ::r:
available from several wells. For example, source rock � 1.0
bitumen yields normalized by weight of rock or by total � ' ' , . • I l l Gas-Prone
organic carbon (TOC) generally increase from immature 0 ' \ . . .
to peak thermal maturity (Table 5.3). The principal =t ' \
regions of oil accumulation in many petroleum , 3 'o 2.5 A Jurassic, Saudi Arabia
.
provinces are confined to areas showing the greatest 0.5 ' .5 • Eocene, Green R., U.S.A.
3
normalized bitumen yields (e.g., figure 21 in ' 3 7 TAl e Toarcian, France
.
Kontorovich, 1984). (A) ' e r ertiory, Greenland
, 4.0
0.1 0.2
Organic Matter Oassifications ATOMIC 0 / C
Kerogen Type
The amount and maceral composition of kerogen 900 I Oil-Prone
determine petroleum potential and can differ vertically
or laterally within a source rock. No universally accepted X 750
� u
classification for kerogen types exists in the literature. In •
z o
this chapter, we use type I, II, lii (Tissot et al., 1974), and - �- 600 II Oil-Prone
IV (Demaison et al., 1983) to describe kerogens (see z Cl
W '-...,
Chapter Appendix A).
U
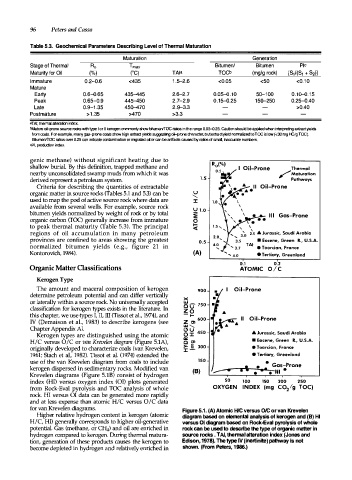
Kerogen types are distinguished using the atomic C> o ::r: 450 A Jurassic, Saudi Arabia
H/C versus 0/C or van Krevelen diagram (Figure 5.1A), a::: CI • Eocene, Green R., U.S.A.
C
originally developed to characterize coals (van Krevelen, >- E Joo e Toarcian, France
-
::r:
1961; Stach et al., 1982). Tissot et al. (1974) extended the e Tertiary, Greenland
use of the van Krevelen diagram from coals to include 150 •
Gas-Prone
•
kerogen dispersed in sedimentary rocks. Modified van (B) __. • ' • •• • Ill •
Krevelen diagrams (Figure 5.1B) consist of hydrogen
index (HI) versus oxygen index (OI) plots generated 50 100 150 200 250
from Rock-Eva! pyrolysis and TOC analysis of whole OXYGEN I N DEX (mg C0 lg TOC)
2
rock. HI versus OI data can be generated more rapidly
and at less expense than atomic H/C versus 0/C data
for van Krevelen diagrams. Figure 5.1. (A) Atomic HIC versus 0/C or van Krevelen
Higher relative hydrogen content in kerogen (atomic diagram base on elemental analysis of kerogen and (B) HI
H/C, HI) generally corresponds to higher oil-generative versus 01 diagram base on Rock-Eval pyrolysis of whole
potential. Gas (methane, or C� and oil are enriched in rock can be used to describe the type of organic matter in
hydrogen compared to kerogen. During thermal matura source rocks . TAl, thennal alteration index (Jones and
tion, generation of these products causes the kerogen to Edison, 1978). The type IV (inertinite) pathway is not
become depleted in hydrogen and relatively enriched in shown. (From Pete, 986. 1 )