
Page 72 - The Petroleum System From Source to Trap
P. 72
3. Petroleum Systems of the World Involving Upper Jurassic Source Rocks 65
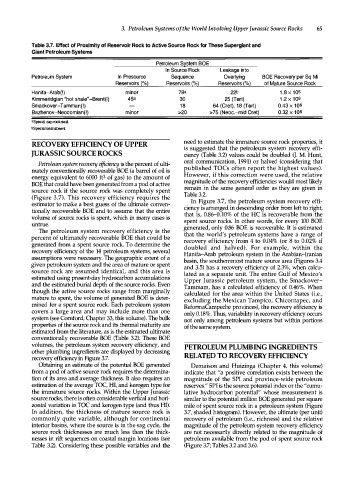
Table 3.7. Effect of Proximity of Reservoir Rock to Active Source Rock for These Supergiant and
Giant Petroleum Systems
Petroleum S}'stem BOE
In Source Rock Leakage into
Petroleum System In Presource Sequence Overlying BOE Recovery per Sq Mi
Reservoirs (%) Reservoi rs ( %) Reservoirs (%) of Mature Source Rock
Hanifa-Arab{!) minor ?Sa 22b 1 . 8 X 1 0 6
Kimmeridgian "hot shale"-Brent(!) 45 a 30 25 (Tert) 1 . 2 X 1 0 6
Smackover-Tamman(!) 1 8 64 (Cret), 1 8 (Tert) 0.43 X 10⁶
Bazhenov-Neocomian(!) minor >20 >75 (Neoc.-mid Cret) 0.32 X 10⁶
•Special cap rock seal.
bSpecial seal absent.
RECOVERY EFFICIENCY OF UPPER need to estimate the immature source rock properties, it
is suggested that the petroleum system recovery effi
JURASSIC SOURCE ROCKS ciency (Table 3.2) values could be doubled (J. M. Hunt,
oral communication, 1991) or halved (considering that
Petroleum system recovery efficiency is the percent of ulti
mately conventionally recoverable BOE (a barrel of oil is published TOCs often report the highest values).
energy equivalent to 6000 ft3 of gas) to the amount of However, if this correction were used, the relative
BOE that could have been generated from a pod of active magnitude of the recovery efficiencies would most likely
source rock if the source rock was completely spent remain in the same general order as they are given in
(Figure 3.7). This recovery efficiency requires the Table 3.2.
In Figure 3.7, the petroleum system recovery effi
estimator to make a best guess of the ultimate conven ciency is arranged in descending order from left to right,
tionally recoverable BOE and to assume that the entire
volume of source rocks is spent, which in many cases is that is, 0.86-0.10% of the HC is recoverable from the
untrue. spent source rocks. In other words, for every 100 BOE
The petroleum system recovery efficiency is the generated, only 0.86 BOE is recoverable. It is estimated
percent of ultimately recoverable BOE that could be that the world's petroleum systems have a range of
generated from a spent source rock. To determine the recovery efficiency from 4 to 0.04% (or 8 to 0.02% if
doubled and halved). For example, within the
recovery efficiency of the 14 petroleum systems, several Hanifa-Arab petroleum system in the Arabian-Iranian
assumptions were necessary. The geographic extent of a basin, the southernmost mature source area (Figures 3.4
given petroleum system and the area of mature or spent and 3.5) has a recovery efficiency of 2.3%, when calcu
source rock are assumed identical, and this area is lated as a separate unit. The entire Gulf of Mexico's
estimated using present-day hydrocarbon accumulations Upper Jurassic petroleum system, the Smackover
and the estimated burial depth of the source rocks. Even Tammam, has a calculated efficiency of 0.46%. When
though the active source rocks range from marginally calculated for the area within the United States (i.e.,
mature to spent, the volume of generated BOE is deter excluding the Mexican Tampico, Chicontapec, and
mined for a spent source rock. Each petroleum system ReforrnaCampeche provinces), the recovery efficiency is
covers a large area and may include more than one only 0.18%. Thus, variability in recovery efficiency occurs
system (see Cornford, Chapter 33, this volume). The bulk not only among petroleum systems but within portions
properties of the source rock and its thermal maturity are of the same system.
estimated from the literature, as is the estimated ultimate
conventionally recoverable BOE (Table 3.2). These BOE
volumes, the petroleum system recovery efficiency, and PETROLEUM PLUMBING INGREDIENTS
other plumbing ingredients are displayed by decreasing
recovery efficiency in Figure 3.7. RELATED TO RECOVERY EFFICIENCY
Obtaining an estimate of the potential BOE generated Demaison and Huizinga (Chapter 4, this volume)
from a pod of active source rock requires the determina indicate that "a positive correlation exists between the
tion of its area and average thickness. It also requires an magnitude of the SPI and province-wide petroleum
estimation of the average TOC, HI, and kerogen type for reserves." SPI is the source potential index or the "cumu
the immature source rocks. Within the Upper Jurassic lative hydrocarbon potential" whose measurement is
source rocks, there is often considerable vertical and hori similar to the potential million BOE generated per square
zontal variation in TOC and kerogen type (and thus HI). mile of spent source rock in a petroleum system (Figure
In addition, the thickness of mature source rock is 3.7, shaded histogram). However, the ultimate (per unit)
commonly quite variable, although for continental recovery of petroleum (i.e., richness) and the relative
interior basins, where the source is in the sag cycle, the magnitude of the petroleum system recovery efficiency
source rock thicknesses are much less than the thick are not necessarily directly related to the magnitude of
nesses in rift sequences on coastal margin locations (see petroleum available from the pod of spent source rock
Table 3.2). Considering these possible variables and the (Figure 3.7; Tables 3.2 and 3.6).