
Page 42 -
P. 42
lE~ ................................................................ ======================== .... ::::::::::::::::::::::::: Pump Hydraulics
The amount of capacity the
~
pump can develop. NPSH _.,..~ ~
9 The level of total head the H Effy
pump can add to the system.
The efficiency with which this
is accomplished.
The minimum amount of
NPSH required ensuring the I
pump can develop that total
hydraulic capability. BEP Q
Figure 2.7: NPSH curve
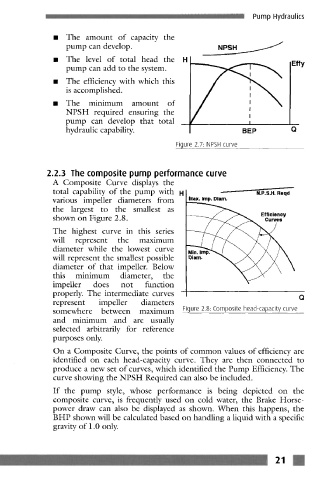
2.2.3 The composite pump performance curve
A Composite Curve displays the
total capability of the pump with H r N'P'S.H. Reqd
various impeller diameters from Max. Imp. Diam,
the largest to the smallest as Efficiency
shown on Figure 2.8.
The highest curve in this series
will represent the maximum
diameter while the lowest curve
will represent the smallest possible Diam. ~
diameter of that impeller. Below
this minimum diameter, the
impeller does not function
properly. The intermediate curves Q
represent impeller diameters
somewhere between maximum Figure 2.8: Composite head-capacity curve
and minimum and arc usually
selected arbitrarily for reference
purposes only.
On a Composite Curve, the points of common values of efficiency are
identified on each head-capacity curve. They are then connected to
produce a new set of curves, which identified the Pump Efficiency. The
curve showing the NPSH Required can also be included.
If the pump style, whose performance is being depicted on the
composite curve, is frequently used on cold water, the Brake Horse-
power draw can also be displayed as shown. When this happens, the
B HP shown will be calculated based on handling a liquid with a specific
gravity of 1.0 only.
21 m