
Page 179 - The Toyota Way Fieldbook
P. 179
Chapter 7. Leveling: Be More Like the Tortoise Than the Hare 155
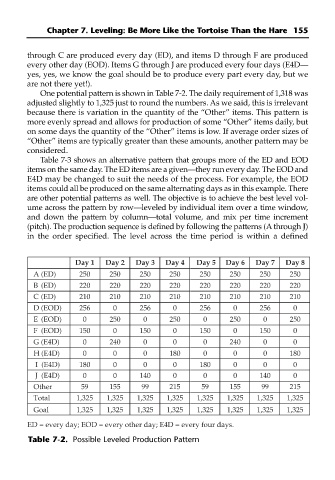
through C are produced every day (ED), and items D through F are produced
every other day (EOD). Items G through J are produced every four days (E4D—
yes, yes, we know the goal should be to produce every part every day, but we
are not there yet!).
One potential pattern is shown in Table 7-2. The daily requirement of 1,318 was
adjusted slightly to 1,325 just to round the numbers. As we said, this is irrelevant
because there is variation in the quantity of the “Other” items. This pattern is
more evenly spread and allows for production of some “Other” items daily, but
on some days the quantity of the “Other” items is low. If average order sizes of
“Other” items are typically greater than these amounts, another pattern may be
considered.
Table 7-3 shows an alternative pattern that groups more of the ED and EOD
items on the same day. The ED items are a given—they run every day. The EOD and
E4D may be changed to suit the needs of the process. For example, the EOD
items could all be produced on the same alternating days as in this example. There
are other potential patterns as well. The objective is to achieve the best level vol-
ume across the pattern by row—leveled by individual item over a time window,
and down the pattern by column—total volume, and mix per time increment
(pitch). The production sequence is defined by following the patterns (A through J)
in the order specified. The level across the time period is within a defined
Day 1 Day 2 Day 3 Day 4 Day 5 Day 6 Day 7 Day 8
A (ED) 250 250 250 250 250 250 250 250
B (ED) 220 220 220 220 220 220 220 220
C (ED) 210 210 210 210 210 210 210 210
D (EOD) 256 0 256 0 256 0 256 0
E (EOD) 0 250 0 250 0 250 0 250
F (EOD) 150 0 150 0 150 0 150 0
G (E4D) 0 240 0 0 0 240 0 0
H (E4D) 0 0 0 180 0 0 0 180
I (E4D) 180 0 0 0 180 0 0 0
J (E4D) 0 0 140 0 0 0 140 0
Other 59 155 99 215 59 155 99 215
Total 1,325 1,325 1,325 1,325 1,325 1,325 1,325 1,325
Goal 1,325 1,325 1,325 1,325 1,325 1,325 1,325 1,325
ED = every day; EOD = every other day; E4D = every four days.
Table 7-2. Possible Leveled Production Pattern