
Page 397 - The Toyota Way Fieldbook
P. 397
370 THE TOYOTA WAY FIELDBOOK
The focus of the results verification should be on the high-level problems
defined in the problem statement. While addressing these specific problems, unre-
lated benefits may be achieved. For example, the changes to the work area above
will result in the reduction of floor space required. This was not a primary objec-
tive, but it provides a potential benefit that may be utilized at a later date.
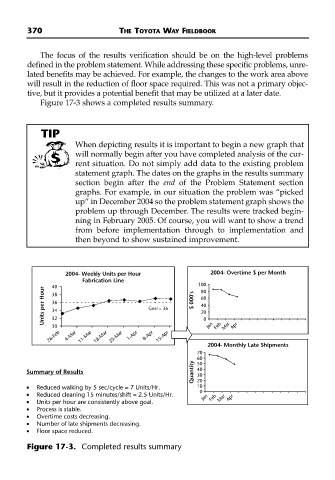
Figure 17-3 shows a completed results summary.
TIP
When depicting results it is important to begin a new graph that
will normally begin after you have completed analysis of the cur-
rent situation. Do not simply add data to the existing problem
statement graph. The dates on the graphs in the results summary
section begin after the end of the Problem Statement section
graphs. For example, in our situation the problem was “picked
up” in December 2004 so the problem statement graph shows the
problem up through December. The results were tracked begin-
ning in February 2005. Of course, you will want to show a trend
from before implementation through to implementation and
then beyond to show sustained improvement.
2004- Weekly Units per Hour 2004- Overtime $ per Month
Fabrication Line 100
40
Units per Hour 38 Goal = 36 $ 000's 60
80
36
40
34
20
32
30 0 Jan Feb Mar Apr
26-Feb 4-Mar 11-Mar 18-Mar 25-Mar 1-Apr 8-Apr 15-Apr
2004- Monthly Late Shipments
70
60
Quantity 30
50
Summary of Results 40
• Reduced walking by 5 sec/cycle = 7 Units/Hr. 20
10
• Reduced cleaning 15 minutes/shift = 2.5 Units/Hr. 0 Jan
• Units per hour are consistently above goal. Feb Mar Apr
• Process is stable.
• Overtime costs decreasing.
• Number of late shipments decreasing.
• Floor space reduced.
Figure 17-3. Completed results summary