
Page 296 -
P. 296
Appendix C
Comparison of Different Power-Generation Methods 261
Countries with the Most Hydroelectric Capacity
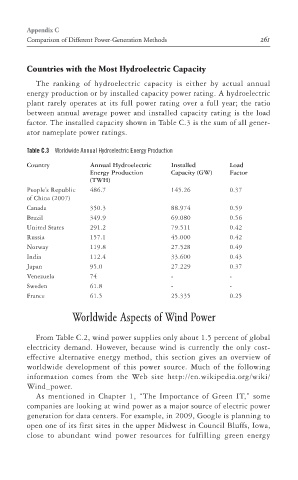
The ranking of hydroelectric capacity is either by actual annual
energy production or by installed capacity power rating. A hydroelectric
plant rarely operates at its full power rating over a full year; the ratio
between annual average power and installed capacity rating is the load
factor. The installed capacity shown in Table C.3 is the sum of all gener-
ator nameplate power ratings.
Table C.3 Worldwide Annual Hydroelectric Energy Production
Country Annual Hydroelectric Installed Load
Energy Production Capacity (GW) Factor
(TWH)
People’s Republic 486.7 145.26 0.37
of China (2007)
Canada 350.3 88.974 0.59
Brazil 349.9 69.080 0.56
United States 291.2 79.511 0.42
Russia 157.1 45.000 0.42
ptg
Norway 119.8 27.528 0.49
India 112.4 33.600 0.43
Japan 95.0 27.229 0.37
Venezuela 74 - -
Sweden 61.8 - -
France 61.5 25.335 0.25
Worldwide Aspects of Wind Power
From Table C.2, wind power supplies only about 1.5 percent of global
electricity demand. However, because wind is currently the only cost-
effective alternative energy method, this section gives an overview of
worldwide development of this power source. Much of the following
information comes from the Web site http://en.wikipedia.org/wiki/
Wind_power.
As mentioned in Chapter 1, “The Importance of Green IT,” some
companies are looking at wind power as a major source of electric power
generation for data centers. For example, in 2009, Google is planning to
open one of its first sites in the upper Midwest in Council Bluffs, Iowa,
close to abundant wind power resources for fulfilling green energy