
Page 302 -
P. 302
Appendix C
Comparison of Different Power-Generation Methods 267
2004. World wind generation capacity more than quadrupled between
2000 and 2006. Eighty-one percent of wind power installations are in
the United States and Europe, but the share of the top five countries in
terms of new installations fell from 71 percent in 2004 to 62 percent in
2006.
Countries with the Most Installed Wind Power Capacity
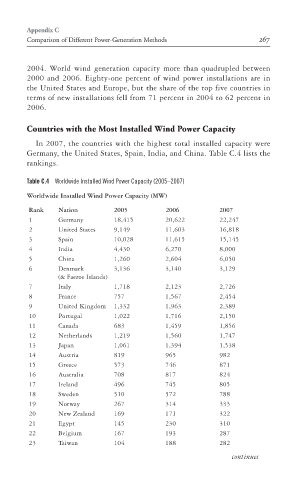
In 2007, the countries with the highest total installed capacity were
Germany, the United States, Spain, India, and China. Table C.4 lists the
rankings.
Table C.4 Worldwide Installed Wind Power Capacity (2005–2007)
Worldwide Installed Wind Power Capacity (MW)
Rank Nation 2005 2006 2007
1 Germany 18,415 20,622 22,247
2 United States 9,149 11,603 16,818
3 Spain 10,028 11,615 15,145 ptg
4 India 4,430 6,270 8,000
5 China 1,260 2,604 6,050
6 Denmark 3,136 3,140 3,129
(& Faeroe Islands)
7 Italy 1,718 2,123 2,726
8 France 757 1,567 2,454
9 United Kingdom 1,332 1,963 2,389
10 Portugal 1,022 1,716 2,150
11 Canada 683 1,459 1,856
12 Netherlands 1,219 1,560 1,747
13 Japan 1,061 1,394 1,538
14 Austria 819 965 982
15 Greece 573 746 871
16 Australia 708 817 824
17 Ireland 496 745 805
18 Sweden 510 572 788
19 Norway 267 314 333
20 New Zealand 169 171 322
21 Egypt 145 230 310
22 Belgium 167 193 287
23 Taiwan 104 188 282
continues