
Page 311 -
P. 311
The Greening of IT
276 How Companies Can Make a Difference for the Environment
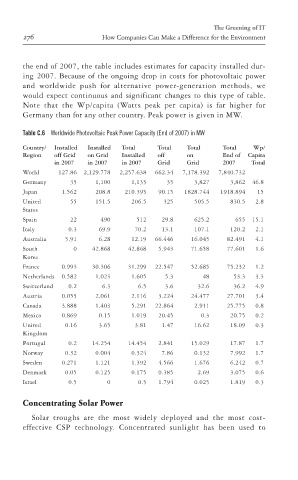
the end of 2007, the table includes estimates for capacity installed dur-
ing 2007. Because of the ongoing drop in costs for photovoltaic power
and worldwide push for alternative power-generation methods, we
would expect continuous and significant changes to this type of table.
Note that the Wp/capita (Watts peak per capita) is far higher for
Germany than for any other country. Peak power is given in MW.
Table C.6 Worldwide Photovoltaic Peak Power Capacity (End of 2007) in MW
Country/ Installed Installed Total Total Total Total Wp/
Region off Grid on Grid Installed off on End of Capita
in 2007 in 2007 in 2007 Grid Grid 2007 Total
World 127.86 2,129.778 2,257.638 662.34 7,178.392 7,840.732
Germany 35 1,100 1,135 35 3,827 3,862 46.8
Japan 1.562 208.8 210.395 90.15 1828.744 1918.894 15
United 55 151.5 206.5 325 505.5 830.5 2.8
States
Spain 22 490 512 29.8 625.2 655 15.1
Italy 0.3 69.9 70.2 13.1 107.1 120.2 2.1
ptg
Australia 5.91 6.28 12.19 66.446 16.045 82.491 4.1
South 0 42.868 42.868 5.943 71.658 77.601 1.6
Korea
France 0.993 30.306 31.299 22.547 52.685 75.232 1.2
Netherlands 0.582 1.023 1.605 5.3 48 53.3 3.3
Switzerland 0.2 6.3 6.5 3.6 32.6 36.2 4.9
Austria 0.055 2.061 2.116 3.224 24.477 27.701 3.4
Canada 3.888 1.403 5.291 22.864 2.911 25.775 0.8
Mexico 0.869 0.15 1.019 20.45 0.3 20.75 0.2
United 0.16 3.65 3.81 1.47 16.62 18.09 0.3
Kingdom
Portugal 0.2 14.254 14.454 2.841 15.029 17.87 1.7
Norway 0.32 0.004 0.324 7.86 0.132 7.992 1.7
Sweden 0.271 1.121 1.392 4.566 1.676 6.242 0.7
Denmark 0.05 0.125 0.175 0.385 2.69 3.075 0.6
Israel 0.5 0 0.5 1.794 0.025 1.819 0.3
Concentrating Solar Power
Solar troughs are the most widely deployed and the most cost-
effective CSP technology. Concentrated sunlight has been used to