
Page 252 - The Mechatronics Handbook
P. 252
0066_frame_C12 Page 19 Wednesday, January 9, 2002 4:22 PM
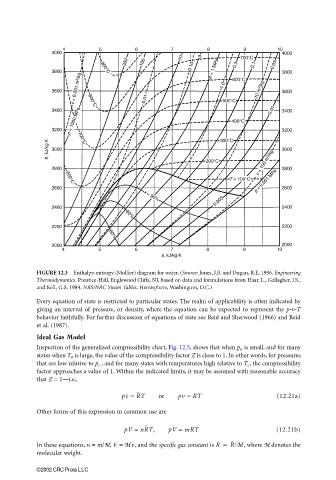
FIGURE 12.3 Enthalpy-entropy (Mollier) diagram for water. (Source: Jones, J.B. and Dugan, R.E. 1996. Engineering
Thermodynamics. Prentice-Hall, Englewood Cliffs, NJ, based on data and formulations from Haar, L., Gallagher, J.S.,
and Kell, G.S. 1984. NBS/NRC Steam Tables. Hemisphere, Washington, D.C.)
Every equation of state is restricted to particular states. The realm of applicability is often indicated by
giving an interval of pressure, or density, where the equation can be expected to represent the p-v-T
behavior faithfully. For further discussion of equations of state see Reid and Sherwood (1966) and Reid
et al. (1987).
Ideal Gas Model
Inspection of the generalized compressibility chart, Fig. 12.5, shows that when p R is small, and for many
states when T R is large, the value of the compressibility factor Z is close to 1. In other words, for pressures
that are low relative to p c , and for many states with temperatures high relative to T c , the compressibility
factor approaches a value of 1. Within the indicated limits, it may be assumed with reasonable accuracy
that Z = 1—i.e.,
pv = RT or pv = RT (12.21a)
Other forms of this expression in common use are
pV = nRT, pV = mRT (12.21b)
In these equations, n = m/M, = M v, and the specific gas constant is R = R/M , where M denotes the
v
molecular weight.
©2002 CRC Press LLC