
Page 80 - Thermal Hydraulics Aspects of Liquid Metal Cooled Nuclear Reactors
P. 80
Rod bundle and pool-type experiments in water serving liquid metal reactors 55
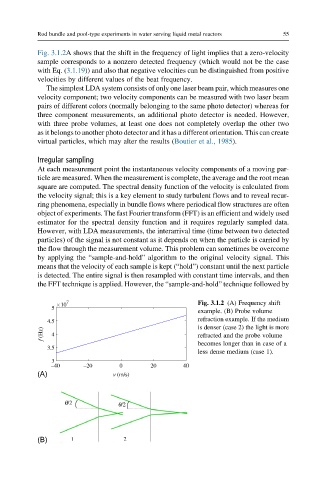
Fig. 3.1.2A shows that the shift in the frequency of light implies that a zero-velocity
sample corresponds to a nonzero detected frequency (which would not be the case
with Eq. (3.1.19)) and also that negative velocities can be distinguished from positive
velocities by different values of the beat frequency.
The simplest LDA system consists of only one laser beam pair, which measures one
velocity component; two velocity components can be measured with two laser beam
pairs of different colors (normally belonging to the same photo detector) whereas for
three component measurements, an additional photo detector is needed. However,
with three probe volumes, at least one does not completely overlap the other two
as it belongs to another photo detector and it has a different orientation. This can create
virtual particles, which may alter the results (Boutier et al., 1985).
Irregular sampling
At each measurement point the instantaneous velocity components of a moving par-
ticle are measured. When the measurement is complete, the average and the root mean
square are computed. The spectral density function of the velocity is calculated from
the velocity signal; this is a key element to study turbulent flows and to reveal recur-
ring phenomena, especially in bundle flows where periodical flow structures are often
object of experiments. The fast Fourier transform (FFT) is an efficient and widely used
estimator for the spectral density function and it requires regularly sampled data.
However, with LDA measurements, the interarrival time (time between two detected
particles) of the signal is not constant as it depends on when the particle is carried by
the flow through the measurement volume. This problem can sometimes be overcome
by applying the “sample-and-hold” algorithm to the original velocity signal. This
means that the velocity of each sample is kept (“hold”) constant until the next particle
is detected. The entire signal is then resampled with constant time intervals, and then
the FFT technique is applied. However, the “sample-and-hold” technique followed by
7
10 Fig. 3.1.2 (A) Frequency shift
5
example. (B) Probe volume
4.5 refraction example. If the medium
f (Hz) 4 is denser (case 2) the light is more
refracted and the probe volume
becomes longer than in case of a
3.5
less dense medium (case 1).
3
–40 –20 0 20 40
(A) v (m/s)
q/2 q/2
(B) 1 2