
Page 102 - Tribology in Machine Design
P. 102
88 Tribology in machine design
where z(x) is the height of the surface above the datum and L is the sampling
length. A less common but statistically more meaningful measure of
average roughness is the root mean square (r.m.s.) or standard deviation o
of the height of the surface from the centre-line, i.e.
The relationship between a and R a depends, to some extent, on the nature of
the surface; for a regular sinusoidal profile a = (n/2j2)R a and for a
i
Gaussian random profile a = (n/2) R a.
The R a value by itself gives no information about the shape of the surface
profile, i.e. about the distribution of the deviations from the mean. The first
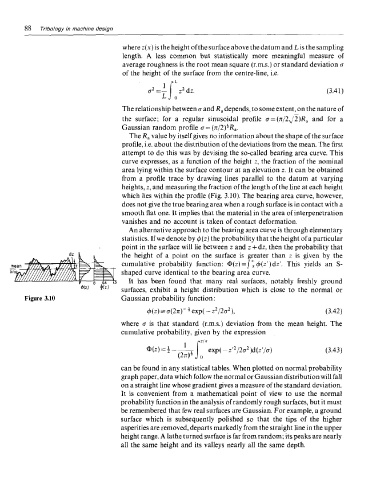
attempt to do this was by devising the so-called bearing area curve. This
curve expresses, as a function of the height z, the fraction of the nominal
area lying within the surface contour at an elevation z. It can be obtained
from a profile trace by drawing lines parallel to the datum at varying
heights, z, and measuring the fraction of the length of the line at each height
which lies within the profile (Fig. 3.10). The bearing area curve, however,
does not give the true bearing area when a rough surface is in contact with a
smooth flat one. It implies that the material in the area of interpenetration
vanishes and no account is taken of contact deformation.
An alternative approach to the bearing area curve is through elementary
statistics. If we denote by </>(z) the probability that the height of a particular
point in the surface will lie between z and z + dz, then the probability that
the height of a point on the surface is greater than z is given by the
cumulative probability function: O(z)= < f*0(z')dz'. This yields an S-
shaped curve identical to the bearing area curve.
It has been found that many real surfaces, notably freshly ground
surfaces, exhibit a height distribution which is close to the normal or
Figure 3.10 Gaussian probability function:
where a is that standard (r.m.s.) deviation from the mean height. The
cumulative probability, given by the expression
can be found in any statistical tables. When plotted on normal probability
graph paper, data which follow the normal or Gaussian distribution will fall
on a straight line whose gradient gives a measure of the standard deviation.
It is convenient from a mathematical point of view to use the normal
probability function in the analysis of randomly rough surfaces, but it must
be remembered that few real surfaces are Gaussian. For example, a ground
surface which is subsequently polished so that the tips of the higher
asperities are removed, departs markedly from the straight line in the upper
height range. A lathe turned surface is far from random; its peaks are nearly
all the same height and its valleys nearly all the same depth.