
Page 159 - Troubleshooting Analog Circuits
P. 159
I46 12. Roundup of “Floobydust”
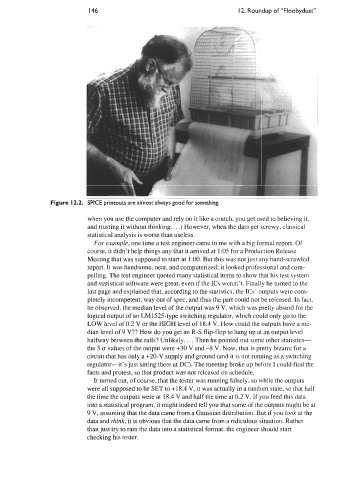
Figure 12.2. SPICE printouts are almost always good for something.
when you use the computer and rely on it like a crutch, you get used to believing it,
and trusting it without thinking.. . .) However, when the data get screwy, classical
statistical analysis is worse than useless.
For example, one time a test engineer came to me with a big formal report. Of
course, it didn’t help things any that it arrived at 1:05 for a Production Release
Meeting that was supposed to start at 1:OO. But this was not just any hand-scrawled
report. It was handsome, neat, and computerized; it looked professional and com-
pelling. The test engineer quoted many statistical items to show that his test system
and statistical software were great, even if the ICs weren’t. Finally he turned to the
last page and explained that, according to the statistics, the ICs’ outputs were com-
pletely incompetent, way out of spec, and thus the part could not be released. In fact,
he observed, the median level of the output was 9 V, which was pretty absurd for the
logical output of an LM1525-type switching regulator, which could only go to the
LOW level of 0.2 V or the HIGH level of 18.4 V. How could the outputs have a me-
dian level of 9 V?? How do you get an R-S flip-flop to hang up at an output level
halfway between the rails? Unlikely. . . . Then he pointed out some other statistics-
the 3 u values of the output were +30 V and -8 V. Now, that is pretty bizarre for a
circuit that has only a +20-V supply and ground (and it is not running as a switching
regulator-it’s just sitting there at DC). The meeting broke up before I could find the
facts and protest, so that product was not released on schedule.
It turned out, of course, that the tester was running falsely, so while the outputs
were all supposed to be SET to +18.4 V, it was actually in a random state, so that half
the time the outputs were at 18.4 V and half the time at 0.2 V. If you feed this data
into a statistical program, it might indeed tell you that some of the outputs might be at
9 V, assuming that the data came from a Gaussian distribution. But if you look at the
data and think, it is obvious that the data came from a ridiculous situation. Rather
than just try to ram the data into a statistical format, the engineer should start
checking his tester.