
Page 276 - Tunable Lasers Handbook
P. 276
236 Norman P. Barnes
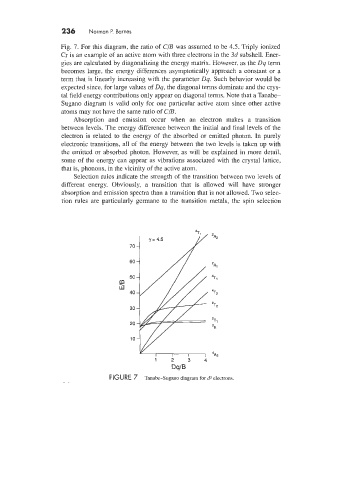
Fig. 7. For this diagram, the ratio of C/B was assumed to be 4.5. Triply ionized
Cr is an example of an active atom with three electrons in the 3d subshell. Ener-
gies are calculated by diagonalizing the energy matrix. However, as the Dq term
becomes large, the energy differences asymptotically approach a constant or a
term that is linearly increasing with the parameter Dq. Such behavior would be
expected since, for large values of Dq, the diagonal terms dominate and the crys-
tal field energy contributions only appear on diagonal terms. Note that a Tanabe-
Sugano diagram is valid only for one particular active atom since other active
atoms may not have the same ratio of C/B.
Absorption and emission occur when an electron makes a transition
between levels. The energy difference between the initial and final levels of the
electron is related to the energy of the absorbed or emitted photon. In purely
electronic transitions, all of the energy between the two levels is taken up with
the emitted or absorbed photon. However, as will be explained in more detail,
some of the energy can appear as vibrations associated with the crystal lattice,
that is, phonons, in the vicinity of the active atom.
Selection rules indicate the strength of the transition between two levels of
different energy. Obviously, a transition that is allowed will have stronger
absorption and emission spectra than a transition that is not allowed. Two selec-
tion rules are particularly germane to the transition metals, the spin selection
1 2 3 4
Dq/B
FIGURE 7 Tanabe-Sugano diagram for d3 electrons.