
Page 225 - Understanding Flight
P. 225
CH08_Anderson 7/25/01 9:01 AM Page 212
212 CHAPTER EIGHT
Lift
0
Drag
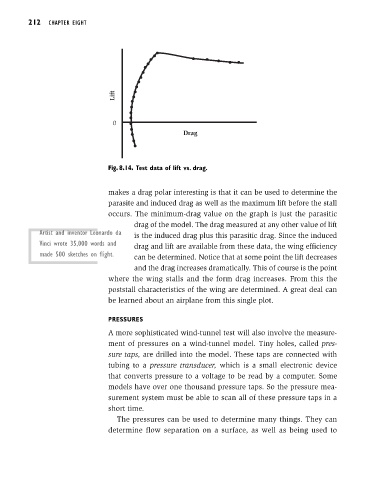
Fig. 8.14. Test data of lift vs. drag.
makes a drag polar interesting is that it can be used to determine the
parasite and induced drag as well as the maximum lift before the stall
occurs. The minimum-drag value on the graph is just the parasitic
drag of the model. The drag measured at any other value of lift
Artist and inventor Leonardo da
is the induced drag plus this parasitic drag. Since the induced
Vinci wrote 35,000 words and
drag and lift are available from these data, the wing efficiency
made 500 sketches on flight.
can be determined. Notice that at some point the lift decreases
and the drag increases dramatically. This of course is the point
where the wing stalls and the form drag increases. From this the
poststall characteristics of the wing are determined. A great deal can
be learned about an airplane from this single plot.
PRESSURES
A more sophisticated wind-tunnel test will also involve the measure-
ment of pressures on a wind-tunnel model. Tiny holes, called pres-
sure taps, are drilled into the model. These taps are connected with
tubing to a pressure transducer, which is a small electronic device
that converts pressure to a voltage to be read by a computer. Some
models have over one thousand pressure taps. So the pressure mea-
surement system must be able to scan all of these pressure taps in a
short time.
The pressures can be used to determine many things. They can
determine flow separation on a surface, as well as being used to