
Page 23 - Understanding Flight
P. 23
CH01_Anderson PFS2 7/25/01 8:55 AM Page 10
10 CHAPTER ONE
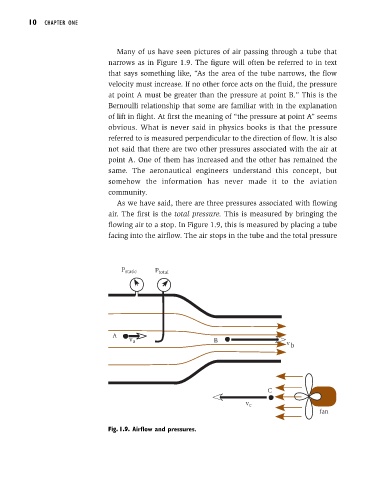
Many of us have seen pictures of air passing through a tube that
narrows as in Figure 1.9. The figure will often be referred to in text
that says something like, “As the area of the tube narrows, the flow
velocity must increase. If no other force acts on the fluid, the pressure
at point A must be greater than the pressure at point B.” This is the
Bernoulli relationship that some are familiar with in the explanation
of lift in flight. At first the meaning of “the pressure at point A” seems
obvious. What is never said in physics books is that the pressure
referred to is measured perpendicular to the direction of flow. It is also
not said that there are two other pressures associated with the air at
point A. One of them has increased and the other has remained the
same. The aeronautical engineers understand this concept, but
somehow the information has never made it to the aviation
community.
As we have said, there are three pressures associated with flowing
air. The first is the total pressure. This is measured by bringing the
flowing air to a stop. In Figure 1.9, this is measured by placing a tube
facing into the airflow. The air stops in the tube and the total pressure
P
P static total
A
v a B v b
C
v c
fan
Fig. 1.9. Airflow and pressures.