
Page 148 - Urban Construction Project Management
P. 148
Lost time 21,755 18,129 25,381 21,755 29,007 18,129 36,258 32,633 32,633 14,503 29,007 7,252 7,252 29,007 108,775 36,258 326,326
Other
Non-lost time 1,269 1,088 1,088 906 1,269 725 1,269 906 1,088 1,632 1,088 1,269 798 725
Lost time 3,626 3,626 7,252 10,878 14,503 10,878 18,129 10,878 10,878 18,129 10,878 3,626 3,626
Bruise, abrasion
Non-lost time 906 1,088 906 1,088 906 725 1,160 906 1,269 1,269 906 1,015 725
Lost time 27,194 18,129 18,129 18,129 18,129 18,129 27,194 18,129 18,129 18,129 18,129 10,878 7,252
Burn
Non-lost time 1,178 725 1,178 906 1,178 725 1,178 1,178 1,178 1,178 1,178 1,088 1,178
INJURY TYPE puncture, laceration Lost time 10,878 10,878 10,878 10,878 10,878 10,878 10,878 29,007 NA 10,878 10,878 9,065 10,878
Cut, Non-lost time 906 906 906 906 906 906 906 906 NA 725 906 725 906
Lost time 29,007 NA 29,007 21,755 32,633 18,129 362,584 NA 14,503 43,510 54,388 32,633 9,065
Fracture
Non-lost time 2,538 NA 5,439 3,626 2,538 1,269 NA NA 1,632 1,632 1,813 1,632 725
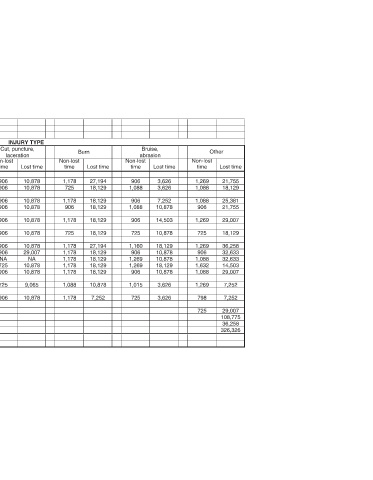
Workers’ Compensation Rates for Wrecking Iron or Steel Structure Workers, CA
Strain, sprain, crush, mash, smash Non-lost Lost time time NA NA NA NA 25,381 1,269 14,503 1,269 9,065 997 9,065 997 36,258 7,252 14,503 1,632 3,626 1,269 12,690 NA 14,503 1,360 9,065 1,088 5,439 1,088
Accident Cost Matrix (Approximate costs in 2008 dollars)
Amputation NA 163,163 525,747 NA 688,910 906,460 188,544 906,460 29,0037 ea up to 135,051 NA NA NA NA 322,700 1,015,235 159,537 326,326 25,381 ea up to 145,034 Adapted from Table 2.1: Stanford Accident Cost Matrix (Costs in 1993 Dollars)
(1) (2) (1) (2) (1) (2) (1) (2) (1) (2) Stanford accident cost accounting.
Body part Head, face Eye(s) Neck and shoulders Arm(s) and elbow(s) Wrist(s) and hand(s) Thumb(s) and finger(s) Back Chest and lower trunk Ribs Hip Leg(s) and knee(s) Foot (feet) and ankle(s) Toe(s) Hernia rupture Heart attack Hearing loss Death Exhibit 5-27
106