
Page 141 - Using ANSYS for Finite Element Analysis Dynamic, Probabilistic, Design and Heat Transfer Analysis
P. 141
128 • using ansys for finite eLement anaLysis
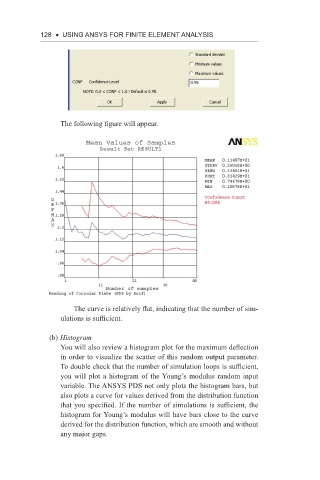
The following figure will appear.
The curve is relatively flat, indicating that the number of sim-
ulations is sufficient.
(b) Histogram
You will also review a histogram plot for the maximum deflection
in order to visualize the scatter of this random output parameter.
To double check that the number of simulation loops is sufficient,
you will plot a histogram of the Young’s modulus random input
variable. The ANSYS PDS not only plots the histogram bars, but
also plots a curve for values derived from the distribution function
that you specified. If the number of simulations is sufficient, the
histogram for Young’s modulus will have bars close to the curve
derived for the distribution function, which are smooth and without
any major gaps.