
Page 133 - Using ANSYS for Finite Element Analysis A Tutorial for Engineers
P. 133
120 • Using ansys for finite element analysis
Plot principle stress distribution:
As shown previously, we need to use element tables to obtain
principle stresses for line elements. Select:
General Postproc > Element Table > Define Table
Click Add....
In the window that appears, enter SMAXI in the User Label for
Item section.
In the first window in the Results Data Item section, scroll down
and select By sequence num. In the second window of the same section,
select NMISC.
In the third window, enter 1 anywhere after the comma click Apply.
Repeat steps 2 to 4, but change SMAXI to SMAXJ in step 3a and
change 1 to 3 in step 3b. Click OK. The Element Table Data window
should now have two variables in it.
Click Close in the Element Table Data window. Select:
General Postproc > Plot Results > Line Elem Res...
Select SMAXI from the LabI pull-down menu and SMAXJ from the
LabJ pull-down menu.
Note: ANSYS can only calculate the stress at a single location on the
element. For this example, we decided to extract the stresses from the I
and J nodes of each element. These are the nodes that are at the ends of
each element.
For this problem, we wanted the principal stresses for the elements.
For the BEAM3 element, this is categorized as NMISC, 1 for the I nodes
and NMISC, 3 for the J nodes. A list of available codes for each ele-
ment can be found in the ANSYS help files (i.e., type help BEAM3 in the
ANSYS Input window).
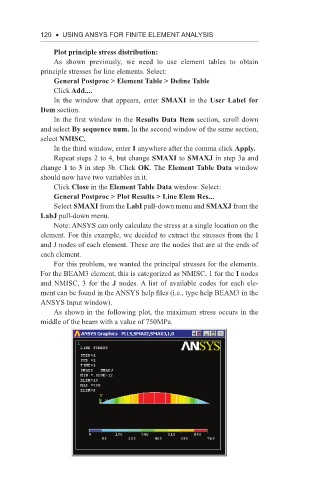
As shown in the following plot, the maximum stress occurs in the
middle of the beam with a value of 750MPa.