
Page 194 - Video Coding for Mobile Communications Efficiency, Complexity, and Resilience
P. 194
Section 7.8. A Comparative Study 171
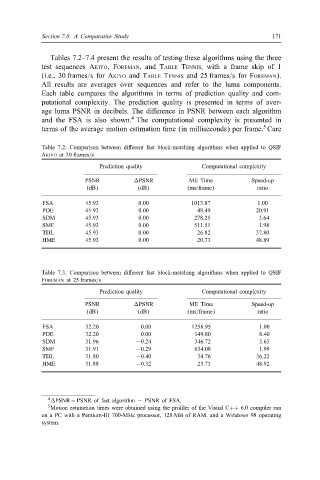
Tables 7.2–7.4 present the results of testing these algorithms using the three
test sequences AKIYO,FOREMAN, and TABLE TENNIS, with a frame skip of 1
(i.e., 30 frames=s for AKIYO and TABLE TENNIS and 25 frames=s for FOREMAN).
All results are averages over sequences and refer to the luma components.
Each table compares the algorithms in terms of prediction quality and com-
putational complexity. The prediction quality is presented in terms of aver-
age luma PSNR in decibels. The di-erence in PSNR between each algorithm
4
and the FSA is also shown. The computational complexity is presented in
5
terms of the average motion estimation time (in milliseconds) per frame. Care
Table 7.2: Comparison between di-erent fast block-matching algorithms when applied to QSIF
AKIYO at 30 frames=s
Prediction quality Computational complexity
PSNR MPSNR ME Time Speed-up
(dB) (dB) (ms/frame) ratio
FSA 45.93 0.00 1013.87 1.00
PDE 45.93 0.00 48.49 20.91
SDM 45.93 0.00 278.25 3.64
SMF 45.93 0.00 511.51 1.98
TDL 45.93 0.00 26.82 37.80
HME 45.93 0.00 20.73 48.89
Table 7.3: Comparison between di-erent fast block-matching algorithms when applied to QSIF
FOREMAN at 25 frames=s
Prediction quality Computational complexity
PSNR MPSNR ME Time Speed-up
(dB) (dB) (ms=frame) ratio
FSA 32.20 0.00 1258.95 1.00
PDE 32.20 0.00 149.80 8.40
SDM 31.96 −0.24 346.72 3.63
SMF 31.91 −0.29 634.08 1.99
TDL 31.80 −0.40 34.76 36.22
HME 31.88 −0.32 25.73 48.92
4 MPSNR = PSNR of fast algorithm − PSNR of FSA.
5 Motion estimation times were obtained using the pro)ler of the Visual C++ 6.0 compiler run
on a PC with a Pentium-III 700-MHz processor, 128 MB of RAM, and a Windows 98 operating
system.