
Page 120 - Visions of the Future Chemistry and Life Science
P. 120
The secret of Nature’s microscopic patterns 109
the information to degrade any excess. This natural equilibrium could also
create the initiator species as a by-product of the reaction which breaks
down the excess monomer.
6.3.2 Of patterns and species
Differences in microarchitecture in relation to component concentration
would appear to occur in our simulations of Selaginella megaspore wall
construction. Imagine an example in which our synthetic wall structure is
determined by concentration of styrene and cyclohexane (in the plant,
these would be sporopollenin monomer and a fatty acid) all in water.
Different arrangements (and sizes) of polystyrene particles occur depend-
ing upon the conditions at the initiation of polymerisation. In the hypo-
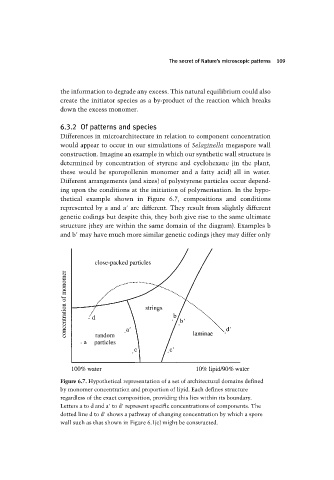
thetical example shown in Figure 6.7, compositions and conditions
represented by a and a are different. They result from slightly different
genetic codings but despite this, they both give rise to the same ultimate
structure (they are within the same domain of the diagram). Examples b
and b may have much more similar genetic codings (they may differ only
Figure 6.7. Hypothetical representation of a set of architectural domains defined
by monomer concentration and proportion of lipid. Each defines structure
regardless of the exact composition, providing this lies within its boundary.
Letters a to d and a to d represent specific concentrations of components. The
dotted line d to d shows a pathway of changing concentration by which a spore
wall such as that shown in Figure 6.1(c) might be constructed.