
Page 180 - Materials Chemistry, Second Edition
P. 180
CAT3525_C06.qxd 1/29/2005 9:56 AM Page 151
Recycling Solid Wastes 151
6.10.3 BENEFITS OF FERROUS RECYCLING
Using ferrous waste in place of iron ore to manufacture steel has many advantages beyond cost con-
siderations. Recycled ferrous is nearly 100% metal and is often readily available or readily trans-
ported in bulk. In contrast, iron ore has to be mined and milled free from tailings and chemical
impurities, and smelted in a blast furnace before it can be converted into steel. The use of ferrous
scrap in comparison with ore imparts substantial energy savings, significantly reduces the amount
of water needed for processing, and causes less air pollution.
Iron and steel can be processed and remelted repeatedly for the manufacture of industrial and
consumer items with absolutely no diminution of quality. Steel made from scrap is chemically and
metallurgically equivalent to steel manufactured from virgin ore (ISRI, 1993b).
6.11 PLASTICS
Plastics possess many properties that make them desirable, if not indispensable, for the modern con-
sumer. These synthetic polymers are shatter-resistant, waterproof, lightweight, durable, and strong.
As a result, plastics have replaced glass and a number of other materials in packaging, construction,
and other uses. The United States is the largest consumer and producer of plastics in the world
which is consistent with its large consumer-driven economy, low-cost chemical feedstocks, and a
well-developed and organized petrochemical infrastructure.
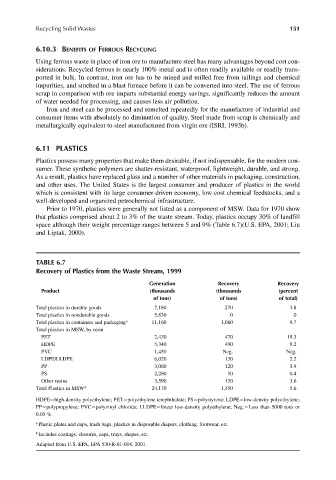
Prior to 1970, plastics were generally not listed as a component of MSW. Data for 1970 show
that plastics comprised about 2 to 3% of the waste stream. Today, plastics occupy 30% of landfill
space although their weight percentage ranges between 5 and 9% (Table 6.7)(U.S. EPA, 2001; Liu
and Liptak, 2000).
TABLE 6.7
Recovery of Plastics from the Waste Stream, 1999
Generation Recovery Recovery
Product (thousands (thousands (percent
of tons) of tons) of total)
Total plastics in durable goods 7,180 270 3.8
Total plastics in nondurable goods 5,830 0 0
Total plastics in containers and packaging a 11,160 1,080 9.7
Total plastics in MSW, by resin
PET 2,430 470 19.3
HDPE 5,340 490 9.2
PVC 1,450 Neg. Neg.
LDPE/LLDPE 6,020 130 2.2
PP 3,060 120 3.9
PS 2,280 10 0.4
Other resins 3,590 130 3.6
Total Plastics in MSW b 24,170 1,350 5.6
HDPE high-density polyethylene; PET polyethylene terephthalate; PS polystyrene; LDPE low-density polyethylene;
PP polypropylene; PVC polyvinyl chloride; LLDPE linear low-density polyethylene; Neg. Less than 5000 tons or
0.05 %.
a Plastic plates and cups, trash bags, plastics in disposable diapers, clothing, footwear, etc.
b Includes coatings, closures, caps, trays, shapes, etc.
Adapted from U.S. EPA, EPA 530-R-01-014, 2001.